Here are the essential concepts you must grasp in order to answer the question correctly.
Probability
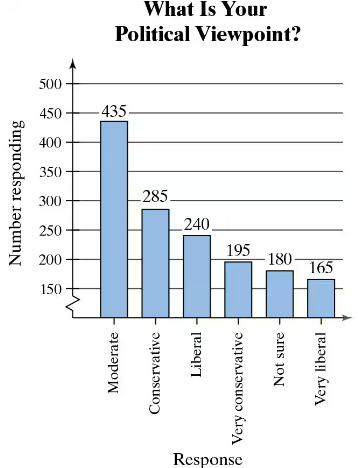
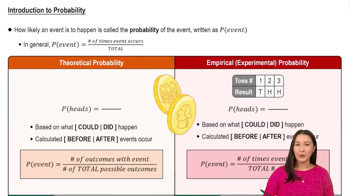
Probability is a measure of the likelihood that a particular event will occur, expressed as a number between 0 and 1. In this context, it involves calculating the chance of randomly selecting a person from the survey who identifies as conservative or very conservative. This is done by dividing the number of individuals in those categories by the total number of respondents.
Recommended video:
Introduction to Probability
Pareto Chart
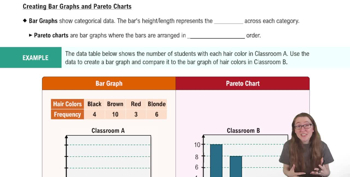
A Pareto chart is a type of bar graph where the values are represented in descending order, highlighting the most significant factors in a dataset. In this case, the chart displays the political viewpoints of respondents, allowing for a quick visual assessment of which viewpoints are most common. Understanding how to read this chart is essential for interpreting the survey results.
Recommended video:
Creating Bar Graphs and Pareto Charts
Categorical Data
Categorical data refers to variables that can be divided into distinct groups or categories, such as political viewpoints in this survey. Each category represents a different response type, and analyzing this data involves counting the number of responses in each category. This is crucial for determining the probability of selecting individuals from specific political groups.
Recommended video:
Introduction to Collecting Data