Here are the essential concepts you must grasp in order to answer the question correctly.
Relative Frequency
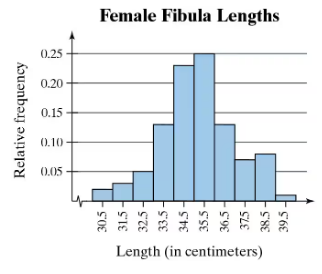
Relative frequency is the ratio of the frequency of a particular category to the total number of observations. It provides a way to understand how often a certain value occurs in relation to the entire dataset, expressed as a fraction or percentage. In histograms, relative frequencies help visualize the distribution of data points across different intervals.
Recommended video:
Intro to Frequency Distributions
Histogram
A histogram is a graphical representation of the distribution of numerical data, where the data is divided into intervals (bins) and the frequency of data points within each interval is represented by the height of bars. In the context of relative frequency, the height of each bar indicates the proportion of the total observations that fall within each interval, allowing for easy comparison of different ranges.
Recommended video:
Peaks in Distribution
Peaks in a distribution refer to the highest points in a histogram, indicating the intervals with the greatest frequency of data points. Identifying these peaks helps in understanding the most common values within the dataset. In the provided histogram, the peaks around 34 and 35 centimeters suggest that these lengths of female fibula are the most frequently observed in the sample.
Recommended video:
Uniform Distribution Example 1