Here are the essential concepts you must grasp in order to answer the question correctly.
Linear Correlation Coefficient (r)
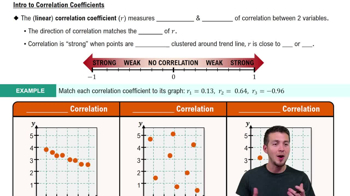
The linear correlation coefficient, denoted as r, quantifies the strength and direction of a linear relationship between two variables. Its value ranges from -1 to 1, where 1 indicates a perfect positive correlation, -1 indicates a perfect negative correlation, and 0 indicates no correlation. Understanding r is crucial for interpreting the relationship between pulse rates and IQ scores in the given data.
Recommended video:
Paired Data
Paired data refers to two sets of related observations, where each pair consists of one measurement from each variable. In this context, each adult's pulse rate is paired with their corresponding IQ score. Analyzing paired data allows for the examination of potential relationships or correlations between the two variables, which is essential for estimating r.
Recommended video:
Visualizing Qualitative vs. Quantitative Data
Random Sampling
Random sampling is a technique used to select a subset of individuals from a larger population, ensuring that every individual has an equal chance of being chosen. This method helps to eliminate bias and allows for generalization of results. In this question, the pulse rates and IQ scores are obtained from 50 randomly selected adults, which enhances the validity of the correlation analysis.
Recommended video:
Sampling Distribution of Sample Proportion