Here are the essential concepts you must grasp in order to answer the question correctly.
Histogram
A histogram is a graphical representation of the distribution of numerical data, where the data is divided into intervals (bins) and the frequency of data points within each interval is represented by the height of bars. It helps visualize the shape, central tendency, and variability of the data, making it easier to identify patterns such as skewness or modality.
Recommended video:
Normal Distribution
Normal distribution, often referred to as a bell curve, is a probability distribution that is symmetric about the mean, indicating that data near the mean are more frequent in occurrence than data far from the mean. In a normal distribution, approximately 68% of the data falls within one standard deviation of the mean, which is crucial for understanding the spread and likelihood of data points.
Recommended video:
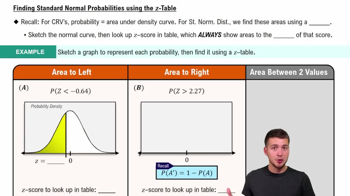
Finding Standard Normal Probabilities using z-Table
Frequency Distribution
A frequency distribution is a summary of how often each value occurs in a dataset. It organizes data into categories or intervals, allowing for easy analysis of the data's distribution. This foundational concept is essential for constructing histograms, as it provides the necessary counts for each bin that will be visually represented in the histogram.
Recommended video:
Intro to Frequency Distributions