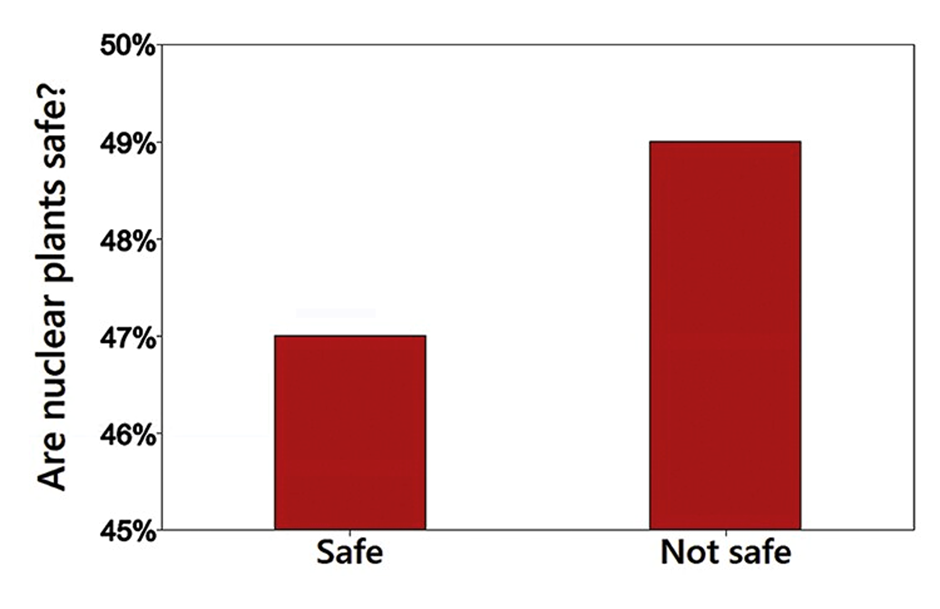
Roller Coaster Speed Outlier Identify any outliers among the data listed for Exercise 1.
Table of contents
- 1. Intro to Stats and Collecting Data55m
- 2. Describing Data with Tables and Graphs1h 55m
- 3. Describing Data Numerically1h 45m
- 4. Probability2h 16m
- 5. Binomial Distribution & Discrete Random Variables2h 33m
- 6. Normal Distribution and Continuous Random Variables1h 38m
- 7. Sampling Distributions & Confidence Intervals: Mean1h 53m
- 8. Sampling Distributions & Confidence Intervals: Proportion1h 12m
- 9. Hypothesis Testing for One Sample2h 19m
- 10. Hypothesis Testing for Two Samples3h 22m
- 11. Correlation1h 6m
- 12. Regression1h 4m
- 13. Chi-Square Tests & Goodness of Fit1h 20m
- 14. ANOVA1h 0m
2. Describing Data with Tables and Graphs
Visualizing Qualitative vs. Quantitative Data
Problem 14.CRE.4
Textbook Question
Are Nuclear Plants Safe? Using the survey results from Exercise 2 and ignoring those respondents with no opinion, is the following graph somehow misleading? If so, how?


1
Step 1: Observe the graph carefully. The graph compares the percentages of respondents who believe nuclear plants are 'Safe' versus 'Not safe'. The y-axis ranges from 45% to 50%, which is a very narrow range.
Step 2: Identify the potential issue with the graph. The narrow range of the y-axis exaggerates the difference between the two bars, making the 'Not safe' category appear significantly larger than the 'Safe' category, even though the actual difference is small.
Step 3: Understand how this can be misleading. By truncating the y-axis and not starting it at 0%, the visual representation distorts the perception of the data, leading viewers to believe there is a larger disparity between the two categories than there actually is.
Step 4: Consider how the graph could be improved. To avoid misleading representation, the y-axis should start at 0%, providing a more accurate visual comparison of the percentages.
Step 5: Reflect on the importance of ethical graph design. Misleading graphs can influence opinions and decisions, so it is crucial to present data in a way that accurately reflects the true differences without exaggeration.

This video solution was recommended by our tutors as helpful for the problem above
Video duration:
2mPlay a video:
Was this helpful?
Key Concepts
Here are the essential concepts you must grasp in order to answer the question correctly.
Misleading Graphs
A misleading graph can distort the true representation of data, leading to incorrect interpretations. In this case, the bar graph shows a slight difference between the percentages of respondents who believe nuclear plants are safe versus not safe. However, the visual emphasis on the 'Not Safe' category may exaggerate the perceived consensus against safety, potentially misleading viewers about the actual balance of opinions.
Recommended video:
Creating Time-Series Graphs
Survey Sampling
Survey sampling refers to the method of selecting a subset of individuals from a population to estimate characteristics of the whole group. In this context, the question mentions ignoring respondents with no opinion, which can skew the results. Understanding how sampling affects survey outcomes is crucial for evaluating the reliability and validity of the conclusions drawn from the data.
Recommended video:
Sampling Distribution of Sample Proportion
Percentage Representation
Percentage representation is a way to express data as a fraction of 100, making it easier to compare different groups. In the graph, 47% of respondents say nuclear plants are safe, while 49% say they are not. However, the close percentages can be misleading if not contextualized properly, as the difference is minimal and may not reflect a significant majority opinion.
Recommended video:
Guided course
Intro to Histograms
Watch next
Master Visualizing Qualitative vs. Quantitative Data with a bite sized video explanation from Patrick
Start learningRelated Videos
Related Practice
Textbook Question