Heights of Females from ANSUR I and ANSUR II Example 1 in this section used samples of heights of males from Data Set 1 “ANSUR I 1988” and Data Set 2 “ANSUR II 2012.” Listed below are samples of heights (mm) of females from those same data sets. Are the requirements for using the Wilcoxon rank-sum test satisfied? Why or why not?
Table of contents
- 1. Intro to Stats and Collecting Data1h 14m
- 2. Describing Data with Tables and Graphs1h 56m
- 3. Describing Data Numerically2h 5m
- 4. Probability2h 16m
- 5. Binomial Distribution & Discrete Random Variables3h 6m
- 6. Normal Distribution and Continuous Random Variables2h 11m
- 7. Sampling Distributions & Confidence Intervals: Mean3h 23m
- Sampling Distribution of the Sample Mean and Central Limit Theorem19m
- Distribution of Sample Mean - Excel23m
- Introduction to Confidence Intervals15m
- Confidence Intervals for Population Mean1h 18m
- Determining the Minimum Sample Size Required12m
- Finding Probabilities and T Critical Values - Excel28m
- Confidence Intervals for Population Means - Excel25m
- 8. Sampling Distributions & Confidence Intervals: Proportion2h 10m
- 9. Hypothesis Testing for One Sample5h 8m
- Steps in Hypothesis Testing1h 6m
- Performing Hypothesis Tests: Means1h 4m
- Hypothesis Testing: Means - Excel42m
- Performing Hypothesis Tests: Proportions37m
- Hypothesis Testing: Proportions - Excel27m
- Performing Hypothesis Tests: Variance12m
- Critical Values and Rejection Regions28m
- Link Between Confidence Intervals and Hypothesis Testing12m
- Type I & Type II Errors16m
- 10. Hypothesis Testing for Two Samples5h 37m
- Two Proportions1h 13m
- Two Proportions Hypothesis Test - Excel28m
- Two Means - Unknown, Unequal Variance1h 3m
- Two Means - Unknown Variances Hypothesis Test - Excel12m
- Two Means - Unknown, Equal Variance15m
- Two Means - Unknown, Equal Variances Hypothesis Test - Excel9m
- Two Means - Known Variance12m
- Two Means - Sigma Known Hypothesis Test - Excel21m
- Two Means - Matched Pairs (Dependent Samples)42m
- Matched Pairs Hypothesis Test - Excel12m
- Two Variances and F Distribution29m
- Two Variances - Graphing Calculator16m
- 11. Correlation1h 24m
- 12. Regression3h 33m
- Linear Regression & Least Squares Method26m
- Residuals12m
- Coefficient of Determination12m
- Regression Line Equation and Coefficient of Determination - Excel8m
- Finding Residuals and Creating Residual Plots - Excel11m
- Inferences for Slope31m
- Enabling Data Analysis Toolpak1m
- Regression Readout of the Data Analysis Toolpak - Excel21m
- Prediction Intervals13m
- Prediction Intervals - Excel19m
- Multiple Regression - Excel29m
- Quadratic Regression15m
- Quadratic Regression - Excel10m
- 13. Chi-Square Tests & Goodness of Fit2h 21m
- 14. ANOVA2h 28m
9. Hypothesis Testing for One Sample
Steps in Hypothesis Testing
Problem 13.5.3
Textbook Question
Notation For the data given in Exercise 1, identify the values of n1, n2, n3 and N.
 Verified step by step guidance
1
Step 1: Understand the problem. The question asks to identify the values of n1, n2, n3, and N. Here, n1, n2, and n3 represent the sample sizes of three different groups or categories, and N represents the total sample size, which is the sum of all individual sample sizes.
Step 2: Review the data provided in Exercise 1. Locate the sample sizes for each group (n1, n2, n3) in the dataset. These values are typically given as counts or frequencies for each group.
Step 3: Assign the values of n1, n2, and n3 based on the data. For example, if the first group has 10 observations, n1 = 10. Repeat this for the second and third groups to find n2 and n3.
Step 4: Calculate the total sample size, N, by summing up the individual sample sizes. Use the formula: .
Step 5: Verify your calculations to ensure accuracy. Double-check the values of n1, n2, n3, and N to confirm they align with the data provided in Exercise 1.
 Verified video answer for a similar problem:
This video solution was recommended by our tutors as helpful for the problem above
Video duration:
2mPlay a video:
0 Comments
Key Concepts
Here are the essential concepts you must grasp in order to answer the question correctly.
Sample Size (n)
In statistics, the sample size (n) refers to the number of observations or data points collected from a population for analysis. It is crucial for determining the reliability and validity of statistical inferences. Different groups may have different sample sizes, denoted as n1, n2, n3, etc., depending on how the data is segmented.
Recommended video:

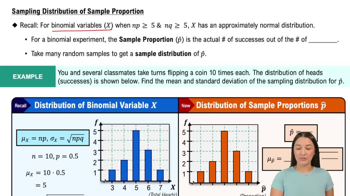
Sampling Distribution of Sample Proportion
Total Sample Size (N)
The total sample size (N) is the sum of all individual sample sizes from different groups. It represents the overall number of observations used in a study and is important for calculating various statistical measures, such as means and variances. Understanding N helps in assessing the power of statistical tests and the generalizability of results.
Recommended video:

Sampling Distribution of Sample Proportion
Data Segmentation
Data segmentation involves dividing a dataset into distinct groups based on specific criteria, such as demographics or experimental conditions. This process allows for more detailed analysis and comparison between groups. Identifying values like n1, n2, and n3 is essential for understanding how the data is structured and how different segments contribute to the overall findings.
Recommended video:
Guided course

Visualizing Qualitative vs. Quantitative Data

 6:21m
6:21mWatch next
Master Step 1: Write Hypotheses with a bite sized video explanation from Patrick
Start learningRelated Videos
Related Practice
Textbook Question
