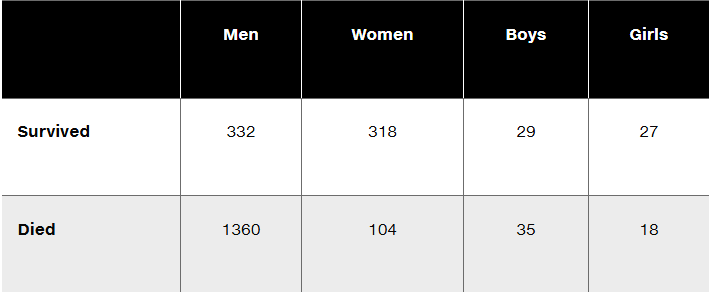
Equivalent Tests A x^2 test involving a 2 x 2 table is equivalent to the test for the difference between two proportions, as described in Section 9-1. Using Table 11-1 from the Chapter Problem, verify that the x^2 test statistic and the z test statistic (found from the test of equality of two proportions) are related as follows: z^2 = x^2 Also show that the critical values have that same relationship.
Table of contents
- 1. Intro to Stats and Collecting Data55m
- 2. Describing Data with Tables and Graphs1h 55m
- 3. Describing Data Numerically1h 45m
- 4. Probability2h 16m
- 5. Binomial Distribution & Discrete Random Variables2h 33m
- 6. Normal Distribution and Continuous Random Variables1h 38m
- 7. Sampling Distributions & Confidence Intervals: Mean1h 53m
- 8. Sampling Distributions & Confidence Intervals: Proportion1h 12m
- 9. Hypothesis Testing for One Sample2h 19m
- 10. Hypothesis Testing for Two Samples3h 22m
- 11. Correlation1h 6m
- 12. Regression1h 4m
- 13. Chi-Square Tests & Goodness of Fit1h 20m
- 14. ANOVA1h 0m
9. Hypothesis Testing for One Sample
Steps in Hypothesis Testing
Problem 11.q.6
Textbook Question
Questions 6–10 refer to the sample data in the following table, which describes the fate of the passengers and crew aboard the Titanic when it sank on April 15, 1912. Assume that the data are a sample from a large population and we want to use a 0.05 significance level to test the claim that surviving is independent of whether the person is a man, woman, boy, or girl.

Identify the null and alternative hypotheses corresponding to the stated claim.

1
Step 1: Understand the problem. The goal is to test the claim that survival on the Titanic is independent of the category of the person (man, woman, boy, or girl). This is a chi-square test for independence, as we are analyzing categorical data in a contingency table.
Step 2: Define the null hypothesis (H₀) and the alternative hypothesis (H₁). The null hypothesis (H₀) states that survival is independent of the category of the person. The alternative hypothesis (H₁) states that survival is not independent of the category of the person.
Step 3: Organize the data. The table provided shows the observed frequencies for each category (men, women, boys, girls) and their survival status (survived or died). These observed frequencies will be used to calculate the expected frequencies under the assumption of independence.
Step 4: Calculate the expected frequencies. Use the formula for expected frequency: E = (row total × column total) / grand total. For each cell in the table, calculate the expected frequency based on the row and column totals.
Step 5: Compute the chi-square test statistic. Use the formula χ² = Σ((O - E)² / E), where O is the observed frequency and E is the expected frequency. Sum this value across all cells in the table. Then compare the test statistic to the critical value from the chi-square distribution table with the appropriate degrees of freedom to determine whether to reject the null hypothesis.

This video solution was recommended by our tutors as helpful for the problem above
Video duration:
2mPlay a video:
Was this helpful?
Key Concepts
Here are the essential concepts you must grasp in order to answer the question correctly.
Null Hypothesis (H0)
The null hypothesis is a statement that indicates no effect or no difference in a given situation. In this context, it posits that survival is independent of gender or age group (men, women, boys, girls). This means that the proportion of survivors is the same across all categories, and any observed differences are due to random chance.
Recommended video:
Guided course
Step 1: Write Hypotheses
Alternative Hypothesis (H1)
The alternative hypothesis is a statement that contradicts the null hypothesis, suggesting that there is an effect or a difference. For this scenario, the alternative hypothesis asserts that survival is dependent on gender or age group, indicating that the proportions of survivors differ among men, women, boys, and girls.
Recommended video:
Guided course
Step 1: Write Hypotheses
Significance Level (α)
The significance level, often denoted as alpha (α), is the threshold for determining whether to reject the null hypothesis. In this case, a significance level of 0.05 means that there is a 5% risk of concluding that a difference exists when there is none. If the p-value obtained from the statistical test is less than 0.05, the null hypothesis would be rejected in favor of the alternative hypothesis.
Recommended video:
Guided course
Step 4: State Conclusion Example 4
Watch next
Master Step 1: Write Hypotheses with a bite sized video explanation from Patrick
Start learningRelated Videos
Related Practice
Textbook Question