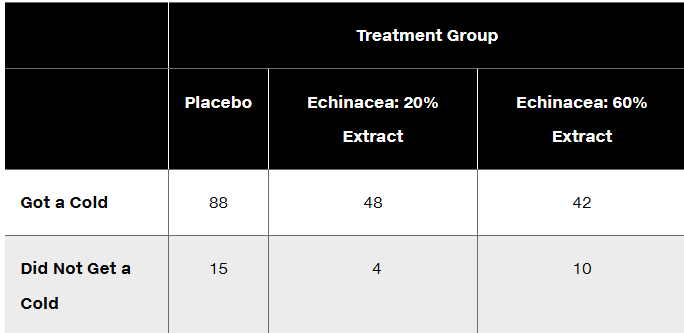
Right-Tailed, Left-Tailed, Two-Tailed Is the hypothesis test described in Exercise 1 right-tailed, left-tailed, or two-tailed? Explain your choice.
Table of contents
- 1. Intro to Stats and Collecting Data55m
- 2. Describing Data with Tables and Graphs1h 55m
- 3. Describing Data Numerically1h 45m
- 4. Probability2h 16m
- 5. Binomial Distribution & Discrete Random Variables2h 33m
- 6. Normal Distribution and Continuous Random Variables1h 38m
- 7. Sampling Distributions & Confidence Intervals: Mean1h 53m
- 8. Sampling Distributions & Confidence Intervals: Proportion1h 12m
- 9. Hypothesis Testing for One Sample2h 19m
- 10. Hypothesis Testing for Two Samples3h 22m
- 11. Correlation1h 6m
- 12. Regression1h 4m
- 13. Chi-Square Tests & Goodness of Fit1h 20m
- 14. ANOVA1h 0m
9. Hypothesis Testing for One Sample
Steps in Hypothesis Testing
Problem 11.2.15
Textbook Question
Clinical Trial of Echinacea In a clinical trial of the effectiveness of echinacea for preventing colds, the results in the table below were obtained (based on data from “An Evaluation of Echinacea Angustifolia in Experimental Rhinovirus Infections,” by Turner et al., New England Journal of Medicine, Vol. 353, No. 4). Use a 0.05 significance level to test the claim that getting a cold is independent of the treatment group. What do the results suggest about the effectiveness of echinacea as a prevention against colds?


1
Step 1: Define the null and alternative hypotheses. The null hypothesis (H₀) states that getting a cold is independent of the treatment group, while the alternative hypothesis (H₁) states that getting a cold is dependent on the treatment group.
Step 2: Organize the data into a contingency table. The table provided already shows the observed frequencies for each treatment group and outcome (Got a Cold vs. Did Not Get a Cold).
Step 3: Calculate the expected frequencies for each cell in the contingency table using the formula: E = (row total × column total) / grand total. For example, calculate the expected frequency for 'Placebo and Got a Cold' as: E = ((88 + 15) × (88 + 48 + 42)) / grand total.
Step 4: Compute the chi-square test statistic using the formula: χ² = Σ((O - E)² / E), where O represents the observed frequency and E represents the expected frequency for each cell. Perform this calculation for all cells in the table.
Step 5: Compare the calculated chi-square test statistic to the critical value from the chi-square distribution table at a significance level of 0.05 with the appropriate degrees of freedom (df = (number of rows - 1) × (number of columns - 1)). If the test statistic exceeds the critical value, reject the null hypothesis; otherwise, fail to reject it.

This video solution was recommended by our tutors as helpful for the problem above
Video duration:
11mPlay a video:
Was this helpful?
Key Concepts
Here are the essential concepts you must grasp in order to answer the question correctly.
Hypothesis Testing
Hypothesis testing is a statistical method used to make decisions about a population based on sample data. It involves formulating a null hypothesis (H0) that represents no effect or no difference, and an alternative hypothesis (H1) that indicates the presence of an effect. In this case, the null hypothesis would state that getting a cold is independent of the treatment group, while the alternative would suggest a dependence.
Recommended video:
Guided course
Step 1: Write Hypotheses
Chi-Square Test of Independence
The Chi-Square Test of Independence is a statistical test used to determine if there is a significant association between two categorical variables. It compares the observed frequencies in each category of a contingency table to the frequencies expected under the null hypothesis. In this scenario, it will help assess whether the incidence of colds is related to the type of treatment received (placebo vs. echinacea).
Recommended video:
Probability of Multiple Independent Events
Significance Level
The significance level, often denoted as alpha (α), is the threshold for determining whether to reject the null hypothesis in hypothesis testing. A common significance level is 0.05, which indicates a 5% risk of concluding that a difference exists when there is none. In this clinical trial, using a 0.05 significance level means that if the p-value from the Chi-Square test is less than 0.05, the results would suggest that echinacea treatment affects the likelihood of getting a cold.
Recommended video:
Guided course
Step 4: State Conclusion Example 4
Watch next
Master Step 1: Write Hypotheses with a bite sized video explanation from Patrick
Start learningRelated Videos
Related Practice
Textbook Question