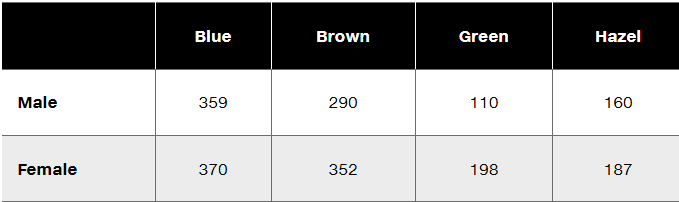
Test for Normality For the hypothesis test described in Exercise 2, the sample sizes are n1 = 2208 and n2 = 1986 When using the F test with these data, is it correct to reason that there is no need to check for normality because both samples have sizes that are greater than 30?
Table of contents
- 1. Intro to Stats and Collecting Data55m
- 2. Describing Data with Tables and Graphs1h 55m
- 3. Describing Data Numerically1h 45m
- 4. Probability2h 16m
- 5. Binomial Distribution & Discrete Random Variables2h 33m
- 6. Normal Distribution and Continuous Random Variables1h 38m
- 7. Sampling Distributions & Confidence Intervals: Mean1h 53m
- 8. Sampling Distributions & Confidence Intervals: Proportion1h 12m
- 9. Hypothesis Testing for One Sample2h 19m
- 10. Hypothesis Testing for Two Samples3h 22m
- 11. Correlation1h 6m
- 12. Regression1h 4m
- 13. Chi-Square Tests & Goodness of Fit1h 20m
- 14. ANOVA1h 0m
9. Hypothesis Testing for One Sample
Steps in Hypothesis Testing
Problem 11.2.13
Textbook Question
Gender and Eye Color The following table describes the distribution of eye colors reported by male and female statistics students (based on data from “Does Eye Color Depend on Gender? It Might Depend on Who or How You Ask,” by Froelich and Stephenson, Journal of Statistics Education, Vol. 21, No. 2). Is there sufficient evidence to warrant rejection of the belief that gender and eye color are independent traits? Use a 0.01 significance level.


1
Step 1: Define the null and alternative hypotheses. The null hypothesis (H₀) states that gender and eye color are independent traits. The alternative hypothesis (H₁) states that gender and eye color are not independent traits.
Step 2: Organize the data into a contingency table. The table provided already shows the observed frequencies for each combination of gender and eye color. Calculate the row totals, column totals, and the grand total (sum of all frequencies).
Step 3: Compute the expected frequencies for each cell in the table using the formula: E = (row total × column total) / grand total. This represents the frequency we would expect if gender and eye color were independent.
Step 4: Calculate the chi-square test statistic using the formula: χ² = Σ((O - E)² / E), where O represents the observed frequency and E represents the expected frequency for each cell. Sum this value across all cells in the table.
Step 5: Compare the calculated χ² value to the critical value from the chi-square distribution table at the 0.01 significance level with the appropriate degrees of freedom (df = (number of rows - 1) × (number of columns - 1)). If χ² exceeds the critical value, reject the null hypothesis; otherwise, fail to reject the null hypothesis.

This video solution was recommended by our tutors as helpful for the problem above
Video duration:
6mPlay a video:
Was this helpful?
Key Concepts
Here are the essential concepts you must grasp in order to answer the question correctly.
Chi-Square Test of Independence
The Chi-Square Test of Independence is a statistical method used to determine if there is a significant association between two categorical variables. In this context, it assesses whether gender and eye color are independent traits. The test compares the observed frequencies in each category to the expected frequencies if the two variables were independent, allowing researchers to evaluate the null hypothesis.
Recommended video:
Probability of Multiple Independent Events
Significance Level
The significance level, often denoted as alpha (α), is the threshold for determining whether to reject the null hypothesis in hypothesis testing. A significance level of 0.01 indicates a 1% risk of concluding that a relationship exists when there is none. This stringent criterion is used to minimize the likelihood of Type I errors, which occur when a true null hypothesis is incorrectly rejected.
Recommended video:
Guided course
Step 4: State Conclusion Example 4
Contingency Table
A contingency table is a matrix that displays the frequency distribution of variables, allowing for the examination of the relationship between them. In this case, the table shows the counts of different eye colors for male and female statistics students. Analyzing this table is essential for performing the Chi-Square Test of Independence, as it provides the necessary data to calculate observed and expected frequencies.
Recommended video:
Guided course
Finding Standard Normal Probabilities using z-Table
Watch next
Master Step 1: Write Hypotheses with a bite sized video explanation from Patrick
Start learningRelated Videos
Related Practice
Textbook Question