Back
BackProblem 8.RE.12
In Exercises 11–16, test the claim about the difference between two population means μ1 and μ2 at the level of significance α. Assume the samples are random and independent, and the populations are normally distributed.
Claim: μ1< μ2; α=0.10. Assume (σ1)^2 ≠ (σ2)^2
Sample statistics: x̅1=0.015, s1=0.011, n1= 8 and x̅2=0.019, s2=0.004, n2= 6
Problem 8.RE.4
In Exercises 1– 4, classify the two samples as independent or dependent and justify your answer.
Sample 1: The fuel efficiencies of 12 cars
Sample 2: The fuel efficiencies of the same 12 cars using an alternative fuel
Problem 8.RE.10
"In Exercises 9 and 10, (a) identify the claim and state Ho and Ha , (b) find the critical value(s) and identify the rejection region(s), (c) find the standardized test statistic z, (d) decide whether to reject or fail to reject the null hypothesis, and (e) interpret the decision in the context of the original claim. Assume the samples are random and independent, and the populations are normally distributed.
A career counselor claims that the mean annual salaries of entry level paralegals in Dayton, Ohio, and Coventry, Rhode Island, are the same. The mean annual salary of 40 randomly selected entry level paralegals in Dayton is $58,180. Assume the population standard deviation is $10,990. The mean annual salary of 35 randomly selected entry level paralegals in Coventry is $61,120. Assume the population standard deviation is $11,850. At α=0.10, is there enough evidence to reject the counselor’s claim? (Adapted from Salary.com)"
Problem 8.RE.18a
In Exercises 17 and 18, (a) identify the claim and state Ho and Ha, Assume the samples are random and independent, and the populations are normally distributed.
A real estate agent claims that there is no difference between the mean household incomes of two neighborhoods. The mean income of 12 randomly selected households from the first neighborhood is $52,750 with a standard deviation of $2900. In the second neighborhood, 10 randomly selected households have a mean income of $51,200 with a standard deviation of $2225. At α=0.01, can you reject the real estate agent’s claim? Assume the population variances are equal.
Problem 8.RE.18b
"In Exercises 17 and 18, (b) find the critical value(s) and identify the rejection region(s), Assume the samples are random and independent, and the populations are normally distributed.
A real estate agent claims that there is no difference between the mean household incomes of two neighborhoods. The mean income of 12 randomly selected households from the first neighborhood is $52,750 with a standard deviation of $2900. In the second neighborhood, 10 randomly selected households have a mean income of $51,200 with a standard deviation of $2225. At α=0.01, can you reject the real estate agent’s claim? Assume the population variances are equal."
Problem 8.RE.7
In Exercises 5– 8, test the claim about the difference between two population means μ1 and μ2 at the level of significance α. Assume the samples are random and independent, and the populations are normally distributed.
Claim: μ1<μ2; α=0.10
Population statistics: σ1= 0.11 and σ2= 0.10
Sample statistics: x̅1 = 0.28, n1 = 41, and x̅2= 0.33, n2= 34
Problem 8.RE.18c
In Exercises 17 and 18, (c) find the standardized test statistic t, Assume the samples are random and independent, and the populations are normally distributed.
A real estate agent claims that there is no difference between the mean household incomes of two neighborhoods. The mean income of 12 randomly selected households from the first neighborhood is $52,750 with a standard deviation of $2900. In the second neighborhood, 10 randomly selected households have a mean income of $51,200 with a standard deviation of $2225. At α=0.01, can you reject the real estate agent’s claim? Assume the population variances are equal.
Problem 8.RE.11
In Exercises 11–16, test the claim about the difference between two population means μ1 and μ2 at the level of significance α. Assume the samples are random and independent, and the populations are normally distributed.
Claim: μ1= μ2; α=0.05. Assume (σ1)^2 = (σ2)^2
Sample statistics: x̅1=228, s1=27, n1= 20 and x̅2=207, s2=25, n2= 13
Problem 8.T.2c
Take this test as you would take a test in class.For each exercise, perform the steps below.
c.Find the critical value(s) and identify the rejection region(s).
A real estate agency says that the mean home sales price in Olathe, Kansas, is greater than in Rolla, Missouri. The mean home sales price for 39 homes in Olathe is $392,453. Assume the population standard deviation is $224,902. The mean home sales price for 38 homes in Rolla is $285,787. Assume the population standard deviation is $330,578. At α=0.05, is there enough evidence to support the agency’s claim? (Adapted from Realtor.com)
Problem 8.T.5
In Exercises 4 and 5, use technology to perform a two-sample t-test to determine whether there is a difference in the mint dates and in the values of coins found on a street from 1985 through 1996 for the two mint locations. Write your conclusion as a sentence. Use α = 0.05.
Value of coins (dollars)
Philadelphia: x̅1=$0.034, s1=$0.054
Denver: x̅2=$0.033, s2=$0.052
Assume population variances are equal.
Problem 8.T.2f
"Take this test as you would take a test in class.For each exercise, perform the steps below.
f. Interpret the decision in the context of the original claim.
A real estate agency says that the mean home sales price in Olathe, Kansas, is greater than in Rolla, Missouri. The mean home sales price for 39 homes in Olathe is $392,453. Assume the population standard deviation is $224,902. The mean home sales price for 38 homes in Rolla is $285,787. Assume the population standard deviation is $330,578. At α=0.05, is there enough evidence to support the agency’s claim? (Adapted from Realtor.com) "
Problem 8.T.2d
Take this test as you would take a test in class.For each exercise, perform the steps below.
d. Find the appropriate standardized test statistic.
A real estate agency says that the mean home sales price in Olathe, Kansas, is greater than in Rolla, Missouri. The mean home sales price for 39 homes in Olathe is $392,453. Assume the population standard deviation is $224,902. The mean home sales price for 38 homes in Rolla is $285,787. Assume the population standard deviation is $330,578. At α=0.05, is there enough evidence to support the agency’s claim? (Adapted from Realtor.com)
Problem 8.T.2e
Take this test as you would take a test in class.For each exercise, perform the steps below.
e. Decide whether to reject or fail to reject the null hypothesis.
A real estate agency says that the mean home sales price in Olathe, Kansas, is greater than in Rolla, Missouri. The mean home sales price for 39 homes in Olathe is $392,453. Assume the population standard deviation is $224,902. The mean home sales price for 38 homes in Rolla is $285,787. Assume the population standard deviation is $330,578. At α=0.05, is there enough evidence to support the agency’s claim? (Adapted from Realtor.com)
Problem 8.T.4
Take this test as you would take a test in class.For each exercise, perform the steps below.
a. Identify the claim and state and
b.Determine whether the hypothesis test is left-tailed, right-tailed, or two-tailed, and whether to use a z-test or a t-test. Explain your reasoning.
c.Find the critical value(s) and identify the rejection region(s).
d. Find the appropriate standardized test statistic.
e. Decide whether to reject or fail to reject the null hypothesis.
f. Interpret the decision in the context of the original claim.
A demographics researcher claims that the mean household income in a recent year is different for native-born households and foreign-born households. A sample of 18 native-born households has a mean household income of $69,474 and a standard deviation of $21,249. A sample of 21 foreign-born households has a mean household income of $64,900 and a standard deviation of $17,896. At α=0.01, can you support the demographics researcher’s claim? Assume the populations are normally distributed and the population variances are not equal. (Adapted from U.S. Census Bureau)
Problem 8.T.2a
Take this test as you would take a test in class.For each exercise, perform the steps below.
a. Identify the claim and state and
A real estate agency says that the mean home sales price in Olathe, Kansas, is greater than in Rolla, Missouri. The mean home sales price for 39 homes in Olathe is $392,453. Assume the population standard deviation is $224,902. The mean home sales price for 38 homes in Rolla is $285,787. Assume the population standard deviation is $330,578. At α=0.05, is there enough evidence to support the agency’s claim? (Adapted from Realtor.com)
Problem 8.T.2b
Take this test as you would take a test in class.For each exercise, perform the steps below.
b.Determine whether the hypothesis test is left-tailed, right-tailed, or two-tailed, and whether to use a z-test or a t-test. Explain your reasoning.
A real estate agency says that the mean home sales price in Olathe, Kansas, is greater than in Rolla, Missouri. The mean home sales price for 39 homes in Olathe is $392,453. Assume the population standard deviation is $224,902. The mean home sales price for 38 homes in Rolla is $285,787. Assume the population standard deviation is $330,578. At α=0.05, is there enough evidence to support the agency’s claim? (Adapted from Realtor.com)
Problem 8.TM.4
In Exercises 4 and 5, use technology to perform a two-sample t-test to determine whether there is a difference in the mint dates and in the values of coins found on a street from 1985 through 1996 for the two mint locations. Write your conclusion as a sentence. Use α = 0.05.
Mint dates of coins (years)
Philadelphia: x̅1=1984.8, s1=8.6
Denver: x̅2=1983.4, s2=8.4
Assume population variances are equal.
Problem 8.U.1
Confounding Variables A pharmaceutical company has applied for approval to market a new arthritis medication. The research involved a test group that was given the medication and another test group that was given a placebo. Describe some possible confounding variables that could influence the results of the study.
Problem 8.2.5a
Find the critical value(s) for the alternative hypothesis, level of significance , and sample sizes and . Assume that the samples are random and independent, the populations are normally distributed, and the population variances are (a) equal
Ha:μ1<μ2 , α=0.05 , n1=7 , n2=11
Problem 8.3.12a
Testing the Difference Between Two Means (a) identify the claim and state Ho and Ha ,Assume the samples are random and dependent, and the populations are normally distributed.
Interval Training
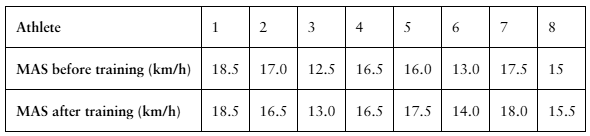
A researcher claims that sprint interval training improves running performance in trained athletes. The table shows the maximum aerobic speed (MAS), in kilometers per hour, of trained athletes before and after six sessions of sprint interval training. At , α=0.10 is there enough evidence to support the researcher’s claim? (Adapted from National Strength and Conditioning Association)
Problem 8.2.3a
Find the critical value(s) for the alternative hypothesis, level of significance , and sample sizes and . Assume that the samples are random and independent, the populations are normally distributed, and the population variances are (a) equal
Ha:μ1≠μ2 , α=0.10 , n1=11 , n2=14
Problem 8.2.6a
Find the critical value(s) for the alternative hypothesis, level of significance , and sample sizes and . Assume that the samples are random and independent, the populations are normally distributed, and the population variances are (a) equal
Ha:μ1≠μ2 , α=0.01 , n1=19 , n2=22
Problem 8.3.18a
Testing the Difference Between Two Means (a) identify the claim and state Ho and Ha .Assume the samples are random and dependent, and the populations are normally distributed.
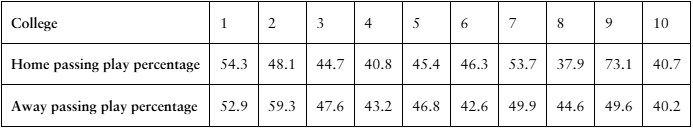
[APPLET] Passing Play Percentages The passing play percentages of 10 randomly selected NCAA Division 1A college football teams for home and away games in the 2020–2021 season are shown in the table. At , α=0.20 is there enough evidence to support the claim that passing play percentage is different for home and away games? (Source: TeamRankings)
Problem 8.2.8a
Find the critical value(s) for the alternative hypothesis, level of significance , and sample sizes and . Assume that the samples are random and independent, the populations are normally distributed, and the population variances are (a) equal .
Ha:μ1<μ2 , α=0.10 , n1=30 , n2=32
Problem 8.3.9a
Testing the Difference Between Two Means (a) identify the claim and state Ho and Ha
[APPLET] Migraines
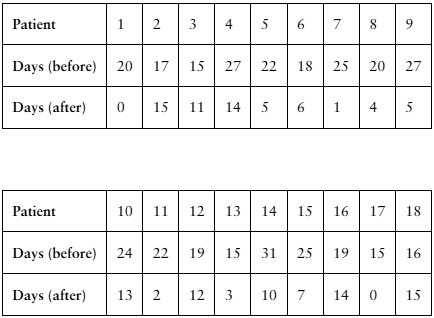
A researcher claims that injections of onabotulinumtoxinA reduce the number of days per month that chronic migraine sufferers have headaches. The table shows the number of days chronic migraine sufferers suffered migraines before and after using the treatment. At , α= 0.01 is there enough evidence to support the researcher’s claim? (Adapted from Journal of Headache and Pain)
Problem 8.3.9b
Testing the Difference Between Two Means, (b) find the critical value(s) and identify the rejection region(s), Assume the samples are random and dependent, and the populations are normally distributed.
[APPLET] Migraines
A researcher claims that injections of onabotulinumtoxinA reduce the number of days per month that chronic migraine sufferers have headaches. The table shows the number of days chronic migraine sufferers suffered migraines before and after using the treatment. At , α= 0.01 is there enough evidence to support the researcher’s claim? (Adapted from Journal of Headache and Pain)
Problem 8.12b
The mean room rate for two adults for a random sample of 26 three-star hotels in Cincinnati has a sample standard deviation of $31. Assume the population is normally distributed. (Adapted from Expedia)
Construct a 99% confidence interval for the population standard deviation.
Problem 8.3.18b
Testing the Difference Between Two Means (b) find the critical value(s) and identify the rejection region(s), Assume the samples are random and dependent, and the populations are normally distributed.
[APPLET] Passing Play Percentages The passing play percentages of 10 randomly selected NCAA Division 1A college football teams for home and away games in the 2020–2021 season are shown in the table. At , α=0.20 is there enough evidence to support the claim that passing play percentage is different for home and away games? (Source: TeamRankings)
Problem 8.3.12b
Testing the Difference Between Two Means (b) find the critical value(s) and identify the rejection region(s), Assume the samples are random and dependent, and the populations are normally distributed.
Interval Training
A researcher claims that sprint interval training improves running performance in trained athletes. The table shows the maximum aerobic speed (MAS), in kilometers per hour, of trained athletes before and after six sessions of sprint interval training. At , α=0.10 is there enough evidence to support the researcher’s claim? (Adapted from National Strength and Conditioning Association)
Problem 8.3.18c
Testing the Difference Between Two Means (c) calculate d̄ and Sd, Assume the samples are random and dependent, and the populations are normally distributed.
[APPLET] Passing Play Percentages The passing play percentages of 10 randomly selected NCAA Division 1A college football teams for home and away games in the 2020–2021 season are shown in the table. At , α=0.20 is there enough evidence to support the claim that passing play percentage is different for home and away games? (Source: TeamRankings)