Back
BackProblem 9.1.31
In Exercise 25, remove the data for the international soccer player with a maximum weight of 170 kilograms and a jump height of 64 centimeters. Describe how this affects the correlation coefficient r.
Problem 9.4.3
"Predicting y-Values In Exercises 3-6, use the multiple regression equation to predict the y-values for the values of the independent variables.
3. Cauliflower Yield The equation used to predict the annual cauliflower yield (in pounds
per acre) is y=24,791+4.508x_1-4.723x_2
where x_1 is the number of acres planted and x_2 is the number of acres harvested.(Adapted from United States Department of Agriculture)
a. x_1 = 36,500, x_2 = 36,100
b. x_1 = 38,100, x_2 = 37,800
c. x_1 = 39,000, x_2 = 38,800
d. x_1 = 42,200, x_2 = 42,100"
Problem 9.3.25
"Constructing and Interpreting a Prediction Interval In Exercises 21-30, construct the indicated prediction interval and interpret the results.
25. Mean Wage Construct a 99% prediction interval for the mean annual wage in Exercise 15 when the percentage of employment in STEM occupations is 13% in the industry."
Problem 9.2.9
"In Exercises 7-12, match the description in the left column with its symbol(s) in the right column.
9. Slope
a. \hat{y}_i
b. y_i
c. b
d. (\bar{x}, \bar{y})
e. m
f. \bar{y}"
Problem 9.3.38
"Confidence Intervals for y-Intercept and Slope
You can construct confidence intervals for the y-intercept B and slope M of the regression line y = Mx + B for the population by using the inequalities below.
y-intercept B :
b - E < B < b + E
where
E = t_c s_e \sqrt{\frac{1}{n} + \frac{\overline{x}^2}{\sum x^2 - \frac{(\Sigma x)^2}{n}}}
slope M :
m - E < M < m + E
where
E = \frac{t_c s_e}{\sqrt{\sum x^2 - \frac{(\Sigma x)^2}{n}}}
The values of m and b are obtained from the sample data, and the critical value t_c is found using Table 5 in Appendix B with n - 2 degrees of freedom.
In Exercises 37 and 38, construct the indicated confidence intervals for B and M using the gross domestic products and carbon dioxide emissions data found in Example 2.
38. 99% confidence interval"
Problem 9.2.27
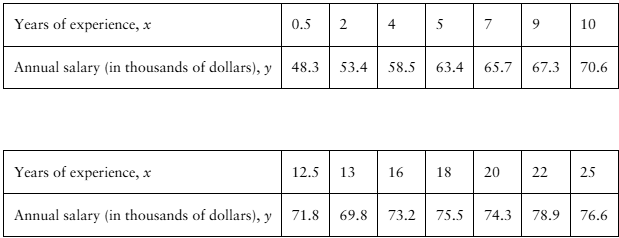
"[APPLET] Registered Nurse Salaries In Exercises 27–30, use the table, which shows the years of experience of 14 registered nurses and their annual salaries (in thousands of dollars). (Adapted from Payscale, Inc.)
27. Correlation Using the scatter plot of the registered nurse salary data shown below, what type of correlation, if any, do you think the data have? Explain.
"
Problem 9.1.9
"In Exercises 9 and 10, identify the explanatory variable and the response variable.
9. A nutritionist wants to determine whether the amounts of water consumed each day by persons of the same weight and on the same diet can be used to predict individual weight
loss."
Problem 9.3.23
"Constructing and Interpreting a Prediction Interval In Exercises 21-30, construct the indicated prediction interval and interpret the results.
23. Points Earned Construct a 90% prediction interval for total points earned in Exercise 13 when the number of goals allowed by the team is 140."
Problem 9.1.20
"In Exercises 19-22, two variables are given that have been shown to have correlation but no cause-and-effect relationship. Describe at least one possible reason for the correlation.
20. Alcohol use and tobacco use"
Problem 9.1.6
6. Discuss the difference between r and p.
Problem 9.1.22
"In Exercises 19-22, two variables are given that have been shown to have correlation but no cause-and-effect relationship. Describe at least one possible reason for the correlation.
22. Marriage rate in Kentucky and number of deaths caused by falling out of a fishing boat"
Problem 9.2.2
2. Two variables have a positive linear correlation. Is the slope of the regression line for the variables positive or negative?
Problem 9.1.32
In Exercise 26, add data for an international soccer player who can perform the half squat with a maximum of 210 kilograms and can sprint 10 meters in 2.00 seconds. Describe how this affects the correlation coefficient r.
Problem 9.1.8
8. In your own words, what does it mean to say "correlation does not imply causation"? List a pair of variables that have correlation but no cause-and-effect relationship.
Problem 9.1.1
1. Two variables have a positive linear correlation. Does the dependent variable increase or decrease as the independent variable increases? What if the variables have a negative linear correlation?
Problem 9.4.6
"Predicting y-Values In Exercises 3-6, use the multiple regression equation to predict the y-values for the values of the independent variables.
6. Elephant Weight The equation used to predict the weight of an elephant (in kilograms) is
y =- 4016+11.5x_1+7.55x_2+12.5x_3
where x_1 represents the girth of the elephant (in centimeters), x_2 represents the length of the elephant (in centimeters), and x_3 represents the circumference of a footpad (in
centimeters). (Source: Field Trip Earth)
a. x_1 = 421, x_2 = 224, x_3 = 144
b. x_1 = 311, x_2 = 171, x_3 = 102
c. x_1 = 376, x_2 = 226, x_3 = 124
d. x_1 =231, x_2 = 135, x_3 = 86"
Problem 9.3.26
"Constructing and Interpreting a Prediction Interval In Exercises 21-30, construct the indicated prediction interval and interpret the results.
26. Voter Turnout Construct a 99% prediction interval for number of ballots cast in Exercise 16 when the voting age population is 210 million."
Problem 9.3.2
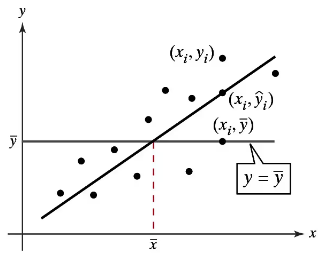
"Graphical Analysis In Exercises 1–3, use the figure.
2. Describe the explained variation about a regression line in words and in symbols."
Problem 9.2.12
"In Exercises 7-12, match the description in the left column with its symbol(s) in the right column.
12. The point a regression line always passes through
a. \hat{y}_i
b. y_i
c. b
d. (\bar{x}, \bar{y})
e. m
f. \bar{y}"
Problem 9.2.4
4. For a set of data and a corresponding regression line, describe all values of x that provide meaningful predictions for y.
Problem 9.3.33
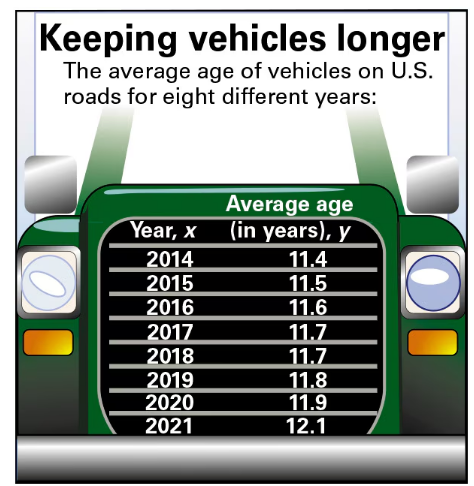
"Old Vehicles In Exercises 31–34, use the figure shown at the left.
33. Coefficient of Determination Find the coefficient of determination r^2 and interpret the results."
Problem 9.3.10
"In Exercises 7-10, use the value of the correlation coefficient r to calculate the coefficient of determination r^2. What does this tell you about the explained variation of the data about the regression line? about the unexplained variation?
10. r =0.881"
Problem 9.1.14
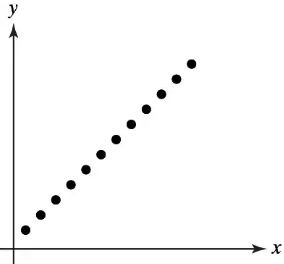
Graphical Analysis In Exercises 11–14, determine whether there is a perfect positive linear correlation, a strong positive linear correlation, a perfect negative linear correlation, a strong negative linear correlation, or no linear correlation between the variables.
Problem 9.2.5
5. To predict y-values using the equation of a regression line, what must be true about the correlation coefficient of the variables?
Problem 9.2.1
1. What is a residual? Explain when a residual is positive, negative, and zero.
Problem 9.3.24
"Constructing and Interpreting a Prediction Interval In Exercises 21-30, construct the indicated prediction interval and interpret the results.
24. Trees Construct a 90% prediction interval for the trunk diameter of a tree in Exercise 14 when the height is 80 feet."
Problem 9.1.3
3. What does the sample correlation coefficient r measure? Which value indicates a stronger correlation: r =0.918 or r =- 0.932? Explain your reasoning.
Problem 9.4.1
1. Interpret the meaning of the coefficient -8.2 in the multiple regression equation y=112.1+0.43x_1-8.2x_2+29.5x_3.
Problem 9.1.2
2. Describe the range of values for the correlation coefficient.
Problem 9.4.5
"Predicting y-Values In Exercises 3-6, use the multiple regression equation to predict the y-values for the values of the independent variables.
5. Black Cherry Tree Volume The volume (in cubic feet) of a black cherry tree can be modeled by the equation
y =- 52.2+0.3x_1 +4.5x_2
where x_1 is the tree's height (in feet) and x_2 is the tree's diameter (in inches). (Source: Journal of the Royal Statistical Society)
a. x_1 = 70, x_2 = 8.6
b. x_1 = 65, x_2 = 11.0
c. x_1 = 83, x_2 = 17.6
d. x_1 = 87, x_2 = 19.6"