Back
BackProblem 6.T.3b
The data set represents the scores of 12 randomly selected students on the SAT Physics Subject Test. Assume the population test scores are normally distributed and the population standard deviation is 108. (Adapted from The College Board)
b. Construct a 90% confidence interval for the population mean. Interpret the results.
Problem 6.T.4a
Use the standard normal distribution or the t-distribution to construct the indicated confidence interval for the population mean of each data set. Justify your decision. If neither distribution can be used, explain why. Interpret the results.
a. In a random sample of 40 patients, the mean waiting time at a dentist’s office was 20 minutes and the standard deviation was 7.5 minutes. Construct a 95% confidence interval for the population mean.
Problem 6.R.1
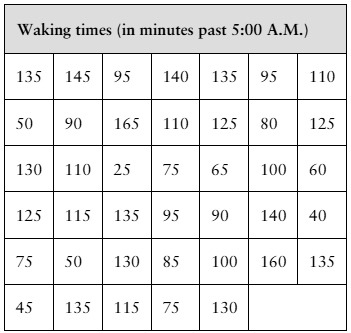
[APPLET] The waking times (in minutes past 5:00 A.M.) of 40 people who start work at 8:00 A.M. are shown in the table at the left. Assume the population standard deviation is 45 minutes. Find (a) the point estimate of the population mean μ and (b) the margin of error for a 90% confidence interval.
Problem 6.R.3
(a) Construct a 90% confidence interval for the population mean in Exercise 1. Interpret the results. (b) Does it seem likely that the population mean could be within 10% of the sample mean? Explain.