Back
BackProblem 6.Tech.3b
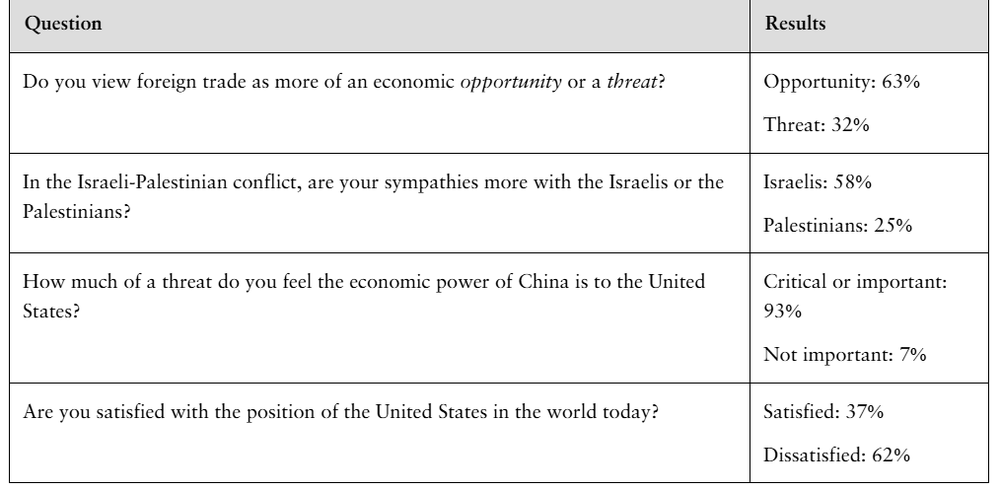
Since 1935, the Gallup Organization has conducted public opinion polls in the United States and around the world. The table shows the results of Gallup’s World Affairs Poll of 2021, in which 1021 U.S. adults were polled. The remaining percentages not shown in the results are adults who were not sure.
b. What was the greatest value you obtained for p^?
Problem 6.T.2c
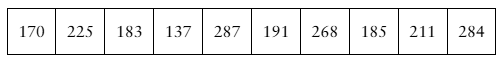
The data set represents the weights (in pounds) of 10 randomly selected black bears from northeast Pennsylvania. Assume the weights are normally distributed. (Source: Pennsylvania Game Commission)
c. Construct a 99% confidence interval for the population standard deviation. Interpret the results.
Problem 6.Tech.1a
Since 1935, the Gallup Organization has conducted public opinion polls in the United States and around the world. The table shows the results of Gallup’s World Affairs Poll of 2021, in which 1021 U.S. adults were polled. The remaining percentages not shown in the results are adults who were not sure.
Use technology to find a 95% confidence interval for the population proportion of adults who
a. view foreign trade as an economic opportunity.
Problem 6.Tech.2
Since 1935, the Gallup Organization has conducted public opinion polls in the United States and around the world. The table shows the results of Gallup’s World Affairs Poll of 2021, in which 1021 U.S. adults were polled. The remaining percentages not shown in the results are adults who were not sure.
[IMAGE]
Find the minimum sample size needed to estimate, with 95% confidence, the population proportion of adults who feel that China’s economic power is a critical or an important economic threat to the United States. Your estimate must be accurate within 2% of the population proportion.
Problem 6.R.29
In Exercises 27–30, find the critical values and for the level of confidence c and sample size n.
c = 0.90, n = 16
Problem 6.RE.28
In Exercises 27–30, find the critical values and for the level of confidence c and sample size n.
c = 0.98, n = 25
Problem 6.RE.27
In Exercises 27–30, find the critical values and for the level of confidence c and sample size n.
c = 0.95, n = 13
Problem 6.1.2
Which statistic is the best unbiased estimator for μ?
a. s
b. xbar
c. the median
d. the mode
Problem 6.1.3
For the same sample statistics, which level of confidence would produce the widest confidence interval? Explain your reasoning.
a. 90%
b. 95%
c. 98%
d. 99%
Problem 6.1.5
In Exercises 5–8, find the critical value zc necessary to construct a confidence interval at the level of confidence c.
c = 0.80
Problem 6.1.8
In Exercises 5–8, find the critical value zc necessary to construct a confidence interval at the level of confidence c.
c = 0.97
Problem 6.1.9
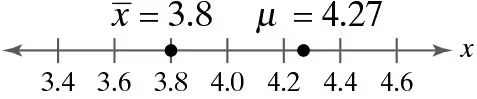
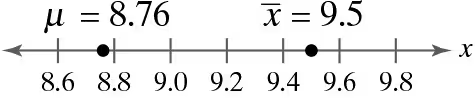
Graphical Analysis In Exercises 9–12, use the values on the number line to find the sampling error.
Problem 6.1.10
Graphical Analysis In Exercises 9–12, use the values on the number line to find the sampling error.
Problem 6.1.13
In Exercises 13–16, find the margin of error for the values of c, σ and n.
c = 0.95, σ = 5.2, n = 30
Problem 6.1.16
In Exercises 13–16, find the margin of error for the values of c, σ and n.
c = 0.975, σ = 4.6, n = 100
Problem 6.1.17
Matching In Exercises 17–20, match the level of confidence c with the appropriate confidence interval. Assume each confidence interval is constructed for the same sample statistics.
c = 0.88
Problem 6.1.20
Matching In Exercises 17–20, match the level of confidence c with the appropriate confidence interval. Assume each confidence interval is constructed for the same sample statistics.
c = 0.98
Problem 6.1.22
In Exercises 21–24, construct the indicated confidence interval for the population mean μ.
c = 0.95, xbar = 31.39, σ = 0.80, n = 82.
Problem 6.1.24
In Exercises 21–24, construct the indicated confidence interval for the population mean μ.
c = 0.80, xbar = 20.6, σ = 4.7, n = 100.
Problem 6.1.26
In Exercises 25–28, use the confidence interval to find the margin of error and the sample mean.
(21.61, 30.15)
Problem 6.1.28
In Exercises 25–28, use the confidence interval to find the margin of error and the sample mean.
(3.144, 3.176)
Problem 6.1.29
In Exercises 29–32, determine the minimum sample size n needed to estimate for the values of c, σ, and E.
c = 0.90, σ = 6.8, E = 1.
Problem 6.1.30
In Exercises 29–32, determine the minimum sample size n needed to estimate for the values of c, σ, and E.
c = 0.95, σ = 2.5, E = 1.
Problem 6.1.31
In Exercises 29–32, determine the minimum sample size n needed to estimate for the values of c, σ, and E.
c = 0.80, σ = 4.1, E = 2.
Problem 6.1.58c
Finite Population Correction Factor In Exercises 57 and 58, use the information below.
In this section, you studied the construction of a confidence interval to estimate a population mean. In each case, the underlying assumption was that the sample size n was small in comparison to the population size N. When n ≥ 0.05N however, the formula that determines the standard error of the mean needs to be adjusted, as shown below.
[IMAGE]
Recall from the Section 5.4 exercises that the expression sqrt[(N-n)/(n-1)] is called a finite population correction factor. The margin of error is
[IMAGE]
Use the finite population correction factor to construct each confidence interval for the population mean.
c. c = 0.95, xbar = 40.3, σ = 0.5, N = 300, n = 68.
Problem 6.1.58a
Finite Population Correction Factor In Exercises 57 and 58, use the information below.
In this section, you studied the construction of a confidence interval to estimate a population mean. In each case, the underlying assumption was that the sample size n was small in comparison to the population size N. When n ≥ 0.05N however, the formula that determines the standard error of the mean needs to be adjusted, as shown below.
[IMAGE]
Recall from the Section 5.4 exercises that the expression sqrt[(N-n)/(n-1)] is called a finite population correction factor. The margin of error is
[IMAGE]
Use the finite population correction factor to construct each confidence interval for the population mean.
a. c = 0.99, xbar = 8.6, σ = 4.9, N = 200, n = 25.
Problem 6.1.56b
When all other quantities remain the same, how does the indicated change affect the minimum sample size requirement? Explain.
b. Increase in the error tolerance
Problem 6.1.55
When estimating the population mean, why not construct a 99% confidence interval every time?
Problem 6.1.53a
Soccer Balls A soccer ball manufacturer wants to estimate the mean circumference of soccer balls within 0.15 inch.
a. Determine the minimum sample size required to construct a 99% confidence interval for the population mean. Assume the population standard deviation is 0.5 inch
Problem 6.1.52a
Juice Dispensing Machine A beverage company uses a machine to fill half-gallon bottles with fruit juice (see figure). The company wants to estimate the mean volume of water the machine is putting in the bottles within 0.25 fluid ounce.
[IMAGE]
a. Determine the minimum sample size required to construct a 95% confidence interval for the population mean. Assume the population standard deviation is 1 fluid ounce.