Back
BackProblem 6.2.31b
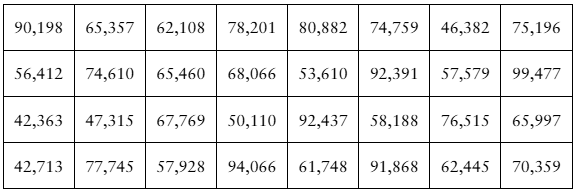
Constructing a Confidence Interval In Exercises 31 and 32, use the data set to (b) find the sample standard deviation
[APPLET] Earnings The annual earnings (in dollars) of 32 randomly selected intermediate level life insurance underwriters (Adapted from Salary.com)
Problem 6.2.36
In Exercises 35–40, use the standard normal distribution or the t-distribution to construct a 95% confidence interval for the population mean. Justify your decision. If neither distribution can be used, explain why. Interpret the results.
In a random sample of 18 months from January 2011 through December 2020, the mean interest rate for 30-year fixed rate home mortgages was 3.95% and the standard deviation was 0.49%. Assume the interest rates are normally distributed. (Source: Freddie Mac)
Problem 6.2.37
In Exercises 35–40, use the standard normal distribution or the t-distribution to construct a 95% confidence interval for the population mean. Justify your decision. If neither distribution can be used, explain why. Interpret the results.
The population standard deviation of the weights of the two-year-old males on a pediatrician’s patient list is 2.49 pounds. The mean weight of a sample of 10 of the two–year–old males is 13.68 pounds. Weights are known to be normally distributed.
Problem 6.2.31
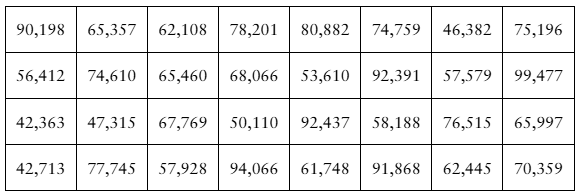
Constructing a Confidence Interval In Exercises 31 and 32, use the data set to (c) construct a 98% confidence interval for the population mean.
[APPLET] Earnings The annual earnings (in dollars) of 32 randomly selected intermediate level life insurance underwriters (Adapted from Salary.com)
Problem 6.2.41
Tennis Ball Manufacturing A company manufactures tennis balls. When the balls are dropped onto a concrete surface from a height of 100 inches, the company wants the mean bounce height to be 55.5 inches. This average is maintained by periodically testing random samples of 25 tennis balls. If the t-value falls between and , then the company will be satisfied that it is manufacturing acceptable tennis balls. For a random sample, the mean bounce height of the sample is 56.0 inches and the standard deviation is 0.25 inch. Assume the bounce heights are approximately normally distributed. Is the company making acceptable tennis balls? Explain.
Problem 6.3.18b
Senate Filibuster You wish to estimate, with 99% confidence, the population proportion of U.S. adults who disapprove of the U.S Senate’s use of the filibuster. Your estimate must be accurate within 2% of the population proportion.
b. Find the minimum sample size needed, using a prior survey that found that 34% of U.S. adults disapprove of the U.S Senate’s use of the filibuster. (Source: Monmouth University)
Problem 6.3.19a
Fast Food You wish to estimate, with 90% confidence, the population proportion of U.S. families who eat fast food at least once per week. Your estimate must be accurate within 3% of the population proportion.
a. No preliminary estimate is available. Find the minimum sample size needed.
Problem 6.3.19b
Fast Food You wish to estimate, with 90% confidence, the population proportion of U.S. families who eat fast food at least once per week. Your estimate must be accurate within 3% of the population proportion.
b. Find the minimum sample size needed, using a prior study that found that 83% of U.S. families eat fast food at least once per week. (Source: The Barbecue Lab)
Problem 6.3.25
Constructing Confidence Intervals In Exercises 25 and 26, use the figure, which shows the results of a survey in which 1051 adults from France, 1042 adults from Germany, 1003 adults from the United Kingdom, and 1000 adults from the United States were asked whether national identity is strongly tied to birthplace. (Source: Pew Research Center)
National Identity Construct a 99% confidence interval for the population proportion of adults who say national identity is strongly tied to birthplace for each country listed.
Problem 6.3.29
Translating Statements In Exercises 29–34, translate the statement into a confidence interval. Approximate the level of confidence.
In a survey of 1502 U.S. adults, 31% said that they use Pinterest. The survey’s margin of error is ±2.9%. (Source: Pew Research Center)
Problem 6.3.30
Translating Statements In Exercises 29–34, translate the statement into a confidence interval. Approximate the level of confidence.
In a survey of 220 U.S. adults ages 18–29, 65% said that they use Snapchat. The survey’s margin of error is ±7.9%. (Source: Pew Research Center)
Problem 6.3.31
Translating Statements In Exercises 29–34, translate the statement into a confidence interval. Approximate the level of confidence.
In a survey of 1000 U.S. adults, 71% think teaching is one of the most important jobs in our country today. The survey’s margin of error is ±3%. (Source: Rasmussen Reports)
Problem 6.3.20a
Alcohol-Impaired Driving You wish to estimate, with 95% confidence, the population proportion of motor vehicle fatalities that were caused by alcohol-impaired driving. Your estimate must be accurate within 5% of the population proportion.
a. No preliminary estimate is available. Find the minimum sample size needed
Problem 6.3.20b
Alcohol-Impaired Driving You wish to estimate, with 95% confidence, the population proportion of motor vehicle fatalities that were caused by alcohol-impaired driving. Your estimate must be accurate within 5% of the population proportion.
b. Find the minimum sample size needed, using a prior study that found that 28% of motor vehicle fatalities were caused by alcohol-impaired driving. (Source: National Highway Traffic Safety Administration)
Problem 6.3.21
In Exercise 11, would it be unusual for the population proportion to be 72.5%? Explain.
Problem 6.3.1
True or False? In Exercises 1 and 2, determine whether the statement is true or false. If it is false, rewrite it as a true statement.
The point estimate for the population proportion of failures is 1-p^
Problem 6.3.5
Finding p^ and q^ In Exercises 3 – 6, let p be the population proportion for the situation. Find point estimates of p and q.
Social Security In a survey of 661 non-retired Americans, 218 said that they expect to rely on Social Security as major source of income when they retire. (Adapted from Gallup)
Problem 6.3.6
Finding p^ and q^ In Exercises 3 – 6, let p be the population proportion for the situation. Find point estimates of p and q.
Private Internet Browsing In a survey of 4272 U.S. adults, 1025 knew that private browsing mode only prevents someone using the same computer from seeing one’s online activities. (Adapted from Pew Research Center)
Problem 6.3.9
In Exercises 7–10, use the confidence interval to find the margin of error and the sample proportion.
(0.512, 0.596)
Problem 6.3.10
In Exercises 7–10, use the confidence interval to find the margin of error and the sample proportion.
(0.087, 0.263)
Problem 6.3.12
Constructing Confidence Intervals In Exercises 11 and 12, construct 90% and 95% confidence intervals for the population proportion. Interpret the results and compare the widths of the confidence intervals.
New Year’s Resolutions In a survey of 1790 U.S. adults in a recent year, 816 have a New Year’s resolution related to their health. (Adapted from Finder)
Problem 6.3.14
Constructing Confidence Intervals In Exercises 13 and 14, construct a 99% confidence interval for the population proportion. Interpret the results.
New Year’s Resolutions In a survey of 1790 U.S. adults in a recent year, 816 have a New Year’s resolution related to their health. (Adapted from Finder)
Problem 6.3.15
LGBT Identification In a survey of 15,349 U.S. adults, 860 identify as lesbian, gay, bisexual, or transgender. Construct a 95% confidence interval for the population proportion of U.S. adults who identify as lesbian, gay, bisexual, or transgender. (Adapted from Gallup)
Problem 6.3.16
Bisexual Idenfitication In a survey of 692 lesbian, gay, bisexual, or transgender U.S adults, 378 said that they consider themselves bisexual. Construct a 90% confidence interval for the population proportion of lesbian, gay, bisexual, or transgender U.S. adults who consider themselves bisexual. (Adapted from Gallup)
Problem 6.3.17a
Congress You wish to estimate, with 95% confidence, the population proportion of likely U.S. voters who think Congress is doing a good or excellent job. Your estimate must be accurate within 4% of the population proportion.
a. No preliminary estimate is available. Find the minimum sample size needed.
Problem 6.3.17b
Congress You wish to estimate, with 95% confidence, the population proportion of likely U.S. voters who think Congress is doing a good or excellent job. Your estimate must be accurate within 4% of the population proportion.
b. Find the minimum sample size needed, using a prior survey that found that 21% of likely U.S. voters think Congress is doing a good or excellent job. (Source: Rasmussen Reports)
Problem 6.3.18a
Senate Filibuster You wish to estimate, with 99% confidence, the population proportion of U.S. adults who disapprove of the U.S Senate’s use of the filibuster. Your estimate must be accurate within 2% of the population proportion.
a. No preliminary estimate is available. Find the minimum sample size needed.
Problem 6.3.32
Translating Statements In Exercises 29–34, translate the statement into a confidence interval. Approximate the level of confidence.
In a survey of 880 unmarried U.S. adults who are living with a partner, 73% say love was a major reason why they decided to move in together. The survey’s margin of error is ±4.8%. (Source: Pew Research Center)
Problem 6.3.33
Translating Statements In Exercises 29–34, translate the statement into a confidence interval. Approximate the level of confidence.
In a survey of 2094 U.S. adults who have used an online dating app, 57% said their personal experience with online dating was positive. The survey’s margin of error is ±3.6%. (Source: Pew Research Center)
Problem 6.3.35
Why Check It? Why is it necessary to check that np^ ≥ 5 and nq^ ≥ 5?