Back
BackProblem 5.1.23
Finding Area
In Exercises 23–36, find the indicated area under the standard normal curve. If convenient, use technology to find the area.
To the left of z=0.33
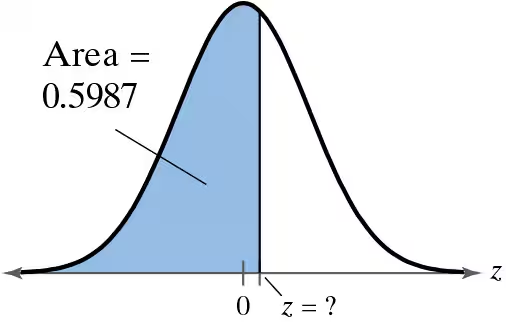
Problem 5.3.24
Finding a z-Score Given an Area In Exercises 23–30, find the indicated z-score.
Find the z-score that has 78.5% of the distribution’s area to its left.
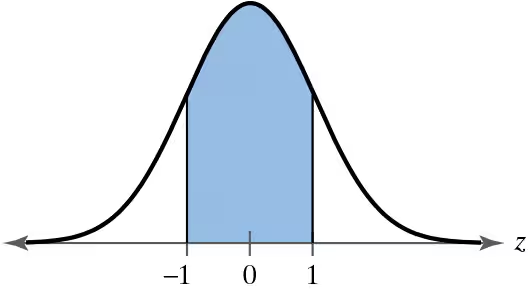
Problem 5.3.18
Graphical Analysis In Exercises 17–22, find the indicated z-score(s) shown in the graph.
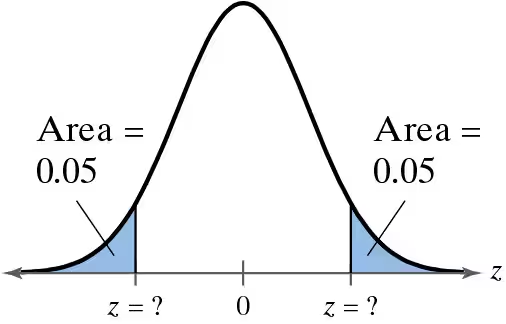
Problem 5.3.21
Graphical Analysis In Exercises 17–22, find the indicated z-score(s) shown in the graph.
Problem 5.4.18
Finding Probabilities In Exercises 15–18, the population mean and standard deviation are given. Find the indicated probability and determine whether the given sample mean would be considered unusual.
For a random sample of n=36, find the probability of a sample mean being less than 12,750 or greater than 12,753 when mu=12750 and 1.7.
Problem 5.4.29
Finding Probabilities for Sampling Distributions In Exercises 29–32, find the indicated probability and interpret the results.
Dow Jones Industrial Average From 1975 through 2020, the mean annual gain of the Dow Jones Industrial Average was 652. A random sample of 32 years is selected from this population. What is the probability that the mean gain for the sample was between 400 and 700? Assume sigma=1540
Problem 5.1.45
Finding Probability In Exercises 41– 46, find the probability of z occurring in the shaded region of the standard normal distribution. If convenient, use technology to find the probability.
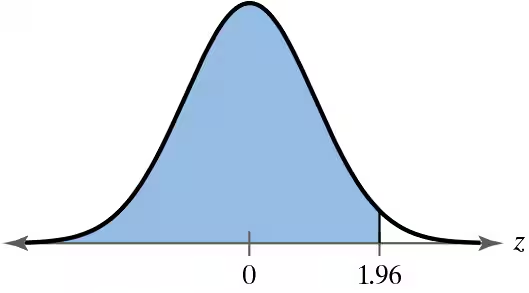
Problem 5.1.42
Finding Probability In Exercises 41– 46, find the probability of z occurring in the shaded region of the standard normal distribution. If convenient, use technology to find the probability.
Problem 5.2.6
Computing Probabilities for Normal Distributions In Exercises 1–6, the random variable x is normally distributed with mean mu=174 and standard deviation sigma=20. Find the indicated probability.
P(172 < x <192)
Problem 5.4.31
Finding Probabilities for Sampling Distributions In Exercises 29–32, find the indicated probability and interpret the results.
Asthma Prevalence by State The mean percent of asthma prevalence of the 50 U.S. states is 9.51%. A random sample of 30 states is selected. What is the probability that the mean percent of asthma prevalence for the sample is greater than 10%? Assume sigma=1.17%
Problem 5.4.19
Interpreting the Central Limit Theorem In Exercises 19–26, find the mean and standard deviation of the indicated sampling distribution of sample means. Then sketch a graph of the sampling distribution.
Renewable Energy During a recent period of two years, the day-ahead prices for renewable energy in Germany (in euros per mega-watt hour) have a mean of 31.58 and a standard deviation of 12.293. Random samples of size 75 are drawn from this population, and the mean of each sample is determined.
Problem 5.1.1
Given the mean of a normal distribution, how can you find the median?
Problem 5.1.3
Describe the inflection points on the graph of a normal distribution. At what x-values are the inflection points located?
Problem 5.4.4
In Exercises 1– 4, a population has a mean mu and a standard deviation sigma. Find the mean and standard deviation of the sampling distribution of sample means with sample size n.
Mu = 1275, sigma =6, n = 1000
Problem 5.1.26
Finding Area
In Exercises 23–36, find the indicated area under the standard normal curve. If convenient, use technology to find the area.
To the left of z=1.365
Problem 5.5.29
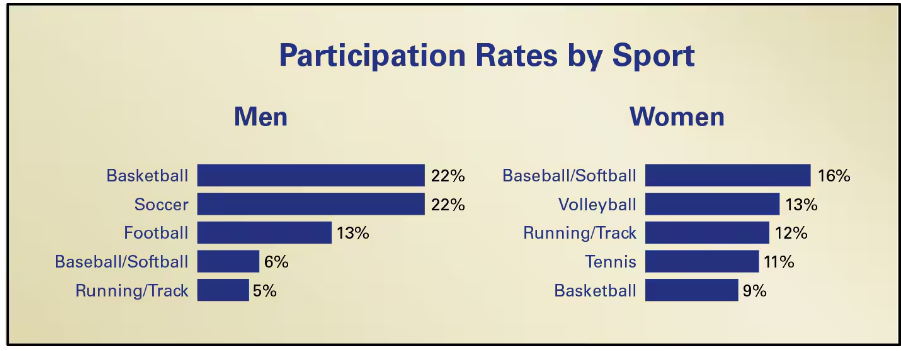
"Getting Physical The figure shows the results of a survey of U.S. adults ages 18 to 29 who were asked whether they participated in a sport. In the survey, 48% of the men and 23% of the women said they participate in sports. The most common sports are shown below. Use this information in Exercises 29 and 30.
You randomly select 250 U.S. men ages 18 to 29 and ask them whether they participate in at least one sport. You find that 80% say no. How likely is this result? Do you think this sample is a good one? Explain your reasoning."
Problem 5.5.17
Approximating a Binomial Distribution In Exercises 17 and 18, a binomial experiment is given. Determine whether you can use a normal distribution to approximate the binomial distribution. If you can, find the mean and standard deviation. If you cannot, explain why.
Bachelor’s Degrees Twenty-two percent of adults over 18 years of age have a bachelor’s degree. You randomly select 20 adults over 18 years of age and ask whether they have a bachelor’s degree.
Problem 5.5.31
Testing a Drug A drug manufacturer claims that a drug cures a rare skin disease 75% of the time. The claim is checked by testing the drug on 100 patients. If at least 70 patients are cured, then this claim will be accepted. Use this information in Exercises 31 and 32.
Find the probability that the claim will be rejected, assuming that the manufacturer’s claim is true.
Problem 5.1.8
Explain how to transform a given x-value of a normally distributed variable x into a z-score.
Problem 5.3.12
Finding a z-Score In Exercises 1–16, use the Standard Normal Table or technology to find the z-score that corresponds to the cumulative area or percentile.
P1.5
Problem 5.4.20
Interpreting the Central Limit Theorem In Exercises 19–26, find the mean and standard deviation of the indicated sampling distribution of sample means. Then sketch a graph of the sampling distribution.
Renewable Energy The zloty is the official currency of Poland. During a recent period of two years, the day-ahead prices for renewable energy in Poland (in zlotys per mega-watt hour) have a mean of 158.51 and a standard deviation of 33.424. Random samples of size 100 are drawn from this population, and the mean of each sample is determined. (Adapted from Multidisciplinary Digital Publishing Institute)
Problem 5.4.42
Conservation About 74% of the residents in a town say that they are making an effort to conserve water or electricity. One hundred ten residents are randomly selected. What is the probability that the sample proportion making an effort to conserve water or electricity is greater than 80%? Interpret your result.
Problem 5.5.3
In Exercises 1–4, the sample size n, probability of success p, and probability of failure q are given for a binomial experiment. Determine whether you can use a normal distribution to approximate the distribution of x.
n=18, p=0.90, q=0.10
Problem 5.2.3
Computing Probabilities for Normal Distributions In Exercises 1–6, the random variable x is normally distributed with mean mu=174 and standard deviation sigma=20. Find the indicated probability.
P(x > 182)
Problem 5.4.17
Finding Probabilities In Exercises 15–18, the population mean and standard deviation are given. Find the indicated probability and determine whether the given sample mean would be considered unusual.
For a random sample of n=45, find the probability of a sample mean being greater than 551 when mu=550 and sigma=3.7.
Problem 5.4.34
Which Is More Likely? Assume that the fertility rates in Exercise 32 are normally distributed. Are you more likely to randomly select a state with a fertility rate of less than 65 or to randomly select a sample of 15 states in which the mean of the state fertility rates is less than 65? Explain.
Problem 5.4.15
Finding Probabilities In Exercises 15–18, the population mean and standard deviation are given. Find the indicated probability and determine whether the given sample mean would be considered unusual.
For a random sample of n=64, find the probability of a sample mean being less than 24.3 when Mu=24 and sigma=1.25.
Problem 5.4.5
True or False? In Exercises 5–8, determine whether the statement is true or false. If it is false, rewrite it as a true statement.
As the sample size increases, the mean of the distribution of sample means increases.
Problem 5.3.15
Finding a z-Score In Exercises 1–16, use the Standard Normal Table or technology to find the z-score that corresponds to the cumulative area or percentile.
P91
Problem 5.5.8
In Exercises 5–8, match the binomial probability statement with its corresponding normal distribution probability statement (a)–(d) after a continuity correction.
P(x<109)
a. P(x>109.5)
b. P(x<108.5)
c. P(x<109.5)
d. P(x>108.5)