Back
BackProblem 5.CR.4c
Use the probability distribution in Exercise 3 to find the probability of randomly selecting a game in which DeMar DeRozan had (c) between two and four personal fouls, inclusive.
Problem 5.CR.12a
Forty-nine percent of U.S. adults think that human activity such as burning fossil fuels contributes a great deal to climate change. You randomly select 25 U.S. adults. Find the probability that the number who think that human activity contributes a great deal to climate change is (a) exactly 12,
Problem 5.CR.12b
Forty-nine percent of U.S. adults think that human activity such as burning fossil fuels contributes a great deal to climate change. You randomly select 25 U.S. adults. Find the probability that the number who think that human activity contributes a great deal to climate change is (b) between 8 and 11, inclusive,
Problem 5.CR.12c
Forty-nine percent of U.S. adults think that human activity such as burning fossil fuels contributes a great deal to climate change. You randomly select 25 U.S. adults. Find the probability that the number who think that human activity contributes a great deal to climate change is (c) less than two. (d) Are any of these events unusual? Explain your reasoning.
Problem 5.T.8
The per capita disposable income for residents of a U.S. city in a recent year is normally distributed, with a mean of about $44,000 and a standard deviation of about $2450. Use this information in Exercises 7–10.
Out of 800 residents, about how many would you expect to have a disposable income of between $40,000 and $42,000?
Problem 5.RE.34a
In Exercises 33 and 34, find the indicated probabilities. If convenient, use technology to find the probabilities.
The daily surface concentration of carbonyl sulfide on the Indian Ocean is normally distributed, with a mean of 9.1 picomoles per liter and a standard deviation of 3.5 picomoles per liter. Find the probability that on a randomly selected day, the surface concentration of carbonyl sulfide on the Indian Ocean is
a. between 5.1 and 15.7 picomoles per liter.
Problem 5.RE.44
Find the positive z-score for which 94% of the distribution’s area lies between -z and z.
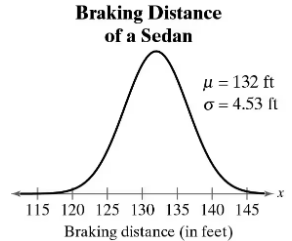
Problem 5.R.48
What braking distance represents the first quartile?
Problem 5.T.2b
In Exercises 2–4, the random variable x is normally distributed with mean mu= 18 and standard deviation sigma 7.6
Find each probability.
b. P(0 < x < 5)
Problem 5.T.3
In Exercises 2–4, the random variable x is normally distributed with mean mu= 18 and standard deviation sigma 7.6
Find the value of x that has 88.3% of the distribution’s area to its left.
Problem 5.CR.6
In Exercises 6–11, find the indicated area under the standard normal curve. If convenient, use technology to find the area.
To the left of z = 0.72
Problem 5.CR.9
In Exercises 6–11, find the indicated area under the standard normal curve. If convenient, use technology to find the area.
Between z = 0 and z = 2.95
Problem 5.CR.16c
The life spans of car batteries are normally distributed, with a mean of 44 months and a standard deviation of 5 months.
c. What is the shortest life expectancy a car battery can have and still be in the top 5% of life expectancies?
Problem 5.Q.8
In a standardized IQ test, scores are normally distributed, with a mean score of 100 and a standardized deviation of 15. Use this information in Exercises 3–10. (Adapted from 123test)
What is the highest score that would still place a person in the bottom 10% of the scores?
Problem 5.Q.1b
Find each probability using the standard normal distribution.
b. P(z < 2.23)
Problem 5.Q.2c
The random variable x is normally distributed with the given parameters. Find each probability.
c. μ = 5.5, σ ≈ 0.08, P(5.36 < x < 5.64)
Problem 5.RE.32
In Exercises 27–32, the random variable x is normally distributed with mean mu=74 and standard deviation sigma=8. Find the indicated probability.
P(72 < x < 82)
Problem 5.RE.28
In Exercises 27–32, the random variable x is normally distributed with mean mu=74 and standard deviation sigma=8. Find the indicated probability.
P(x < 55)
Problem 5.RE.24
In Exercises 21–26, find the indicated probability using the standard normal distribution. If convenient, use technology to find the probability.
P(0.42 < z < 3.15)
Problem 5.RE.21
In Exercises 21–26, find the indicated probability using the standard normal distribution. If convenient, use technology to find the probability.
P(z < 1.28)
Problem 5.RE.17
In Exercises 7–18, find the indicated area under the standard normal curve. If convenient, use technology to find the area.
To the left of z = -1.5 and to the right of z = 1.5
Problem 5.RE.14
In Exercises 7–18, find the indicated area under the standard normal curve. If convenient, use technology to find the area.
Between z = -1.55 and z = 1.04
Problem 5.RE.11
In Exercises 7–18, find the indicated area under the standard normal curve. If convenient, use technology to find the area.
To the left of z = -2.825
Problem 5.RE.8
In Exercises 7–18, find the indicated area under the standard normal curve. If convenient, use technology to find the area.
To the left of z = -1.95
Problem 5.RE.5
In Exercises 5 and 6, find the area of the indicated region under the standard normal curve. If convenient, use technology to find the area.
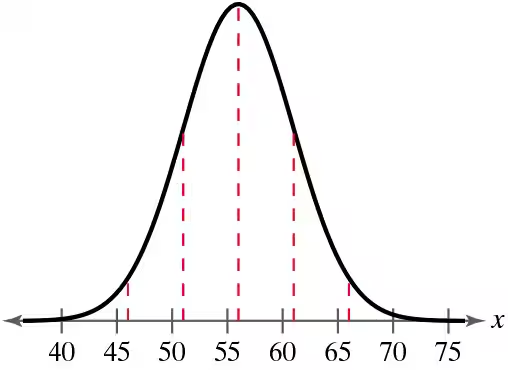
Problem 5.RE.2
In Exercises 1 and 2, use the normal curve to estimate the mean and standard deviation.
Problem 5.R.51a
In Exercises 51 and 52, a population and sample size are given. (a) Find the mean and standard deviation of the population.
The goals scored in a season by the four starting defenders on a soccer team are 1, 2, 0, and 3. Use a sample size of 2.
Problem 5.R.35
Determine whether any of the events in Exercise 33 are unusual. Explain your reasoning.
Problem 5.R.38
In Exercises 37–42, use the Standard Normal Table or technology to find the z-score that corresponds to the cumulative area or percentile.
0.1
Problem 5.R.41
In Exercises 37–42, use the Standard Normal Table or technology to find the z-score that corresponds to the cumulative area or percentile.
P85