81. Genetics A Punnett square is a diagram that shows all possible gene combinations in a cross of parents whose genes are known. When two pink snapdragon flowers (RW) are crossed, there are four equally likely possible outcomes for the genetic makeup of the offspring: red (RR), pink (RW), pink (WR), and white (WW), as shown in the Punnett square at the left. When two pink snapdragons are crossed, what is the probability that the offspring will be (c) white?
Table of contents
- 1. Intro to Stats and Collecting Data1h 14m
- 2. Describing Data with Tables and Graphs1h 56m
- 3. Describing Data Numerically2h 5m
- 4. Probability2h 16m
- 5. Binomial Distribution & Discrete Random Variables3h 6m
- 6. Normal Distribution and Continuous Random Variables2h 11m
- 7. Sampling Distributions & Confidence Intervals: Mean3h 23m
- Sampling Distribution of the Sample Mean and Central Limit Theorem19m
- Distribution of Sample Mean - Excel23m
- Introduction to Confidence Intervals15m
- Confidence Intervals for Population Mean1h 18m
- Determining the Minimum Sample Size Required12m
- Finding Probabilities and T Critical Values - Excel28m
- Confidence Intervals for Population Means - Excel25m
- 8. Sampling Distributions & Confidence Intervals: Proportion2h 10m
- 9. Hypothesis Testing for One Sample5h 8m
- Steps in Hypothesis Testing1h 6m
- Performing Hypothesis Tests: Means1h 4m
- Hypothesis Testing: Means - Excel42m
- Performing Hypothesis Tests: Proportions37m
- Hypothesis Testing: Proportions - Excel27m
- Performing Hypothesis Tests: Variance12m
- Critical Values and Rejection Regions28m
- Link Between Confidence Intervals and Hypothesis Testing12m
- Type I & Type II Errors16m
- 10. Hypothesis Testing for Two Samples5h 37m
- Two Proportions1h 13m
- Two Proportions Hypothesis Test - Excel28m
- Two Means - Unknown, Unequal Variance1h 3m
- Two Means - Unknown Variances Hypothesis Test - Excel12m
- Two Means - Unknown, Equal Variance15m
- Two Means - Unknown, Equal Variances Hypothesis Test - Excel9m
- Two Means - Known Variance12m
- Two Means - Sigma Known Hypothesis Test - Excel21m
- Two Means - Matched Pairs (Dependent Samples)42m
- Matched Pairs Hypothesis Test - Excel12m
- Two Variances and F Distribution29m
- Two Variances - Graphing Calculator16m
- 11. Correlation1h 24m
- 12. Regression3h 33m
- Linear Regression & Least Squares Method26m
- Residuals12m
- Coefficient of Determination12m
- Regression Line Equation and Coefficient of Determination - Excel8m
- Finding Residuals and Creating Residual Plots - Excel11m
- Inferences for Slope31m
- Enabling Data Analysis Toolpak1m
- Regression Readout of the Data Analysis Toolpak - Excel21m
- Prediction Intervals13m
- Prediction Intervals - Excel19m
- Multiple Regression - Excel29m
- Quadratic Regression15m
- Quadratic Regression - Excel10m
- 13. Chi-Square Tests & Goodness of Fit2h 21m
- 14. ANOVA2h 28m
4. Probability
Basic Concepts of Probability
Problem 3.RE.8
Textbook Question
In Exercises 7-12, classify the statement as an example of classical probability, empirical probability, or subjective probability. Explain your reasoning.
8. The probability of randomly selecting five cards of the same suit from a standard deck of 52 playing cards is about 0.002.
 Verified step by step guidance
1
Step 1: Understand the three types of probability classifications: Classical probability is based on theoretical reasoning and assumes equally likely outcomes. Empirical probability is based on observed data or experiments. Subjective probability is based on personal judgment or opinion.
Step 2: Analyze the given statement. The problem mentions the probability of randomly selecting five cards of the same suit from a standard deck of 52 playing cards, which is calculated as approximately 0.002.
Step 3: Determine the method used to calculate this probability. Since the probability is derived from theoretical calculations based on the rules of card combinations and the structure of a standard deck, it aligns with classical probability.
Step 4: Explain the reasoning. Classical probability applies here because the calculation is based on the assumption of equally likely outcomes (all cards in the deck have an equal chance of being selected) and uses combinatorial mathematics to determine the likelihood.
Step 5: Conclude the classification. The statement is an example of classical probability because it relies on theoretical principles rather than experimental data or personal judgment.
 Verified video answer for a similar problem:
This video solution was recommended by our tutors as helpful for the problem above
Video duration:
3mPlay a video:
0 Comments
Key Concepts
Here are the essential concepts you must grasp in order to answer the question correctly.
Classical Probability
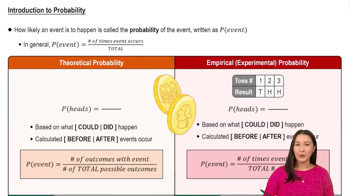
Classical probability is based on the assumption that all outcomes in a sample space are equally likely. It is calculated by taking the number of favorable outcomes and dividing it by the total number of possible outcomes. For example, when drawing cards from a deck, the probability of drawing a specific suit can be determined by the ratio of the number of cards in that suit to the total number of cards.
Recommended video:

Introduction to Probability
Empirical Probability
Empirical probability, also known as experimental probability, is derived from actual experiments or historical data rather than theoretical calculations. It is calculated by observing the frequency of an event occurring in a series of trials and dividing it by the total number of trials. This type of probability is useful when theoretical models are difficult to apply or when real-world data is available.
Recommended video:

Introduction to Probability
Subjective Probability
Subjective probability is based on personal judgment, intuition, or experience rather than on exact calculations or empirical data. It reflects an individual's belief about the likelihood of an event occurring, which can vary from person to person. This type of probability is often used in situations where there is little data available, and decisions must be made based on personal insights or expert opinions.
Recommended video:

Introduction to Probability

 5:37m
5:37mWatch next
Master Introduction to Probability with a bite sized video explanation from Patrick
Start learningRelated Videos
Related Practice
Textbook Question
