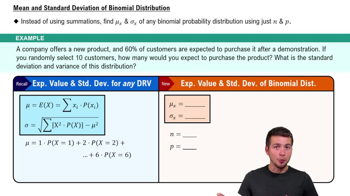
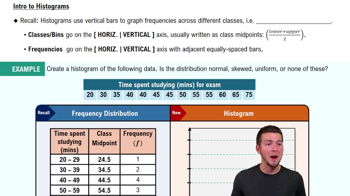
Constructing and Graphing Binomial Distributions In Exercises 27–30, (a) construct a binomial distribution, (b) graph the binomial distribution using a histogram and describe its shape, and (c) identify any values of the random variable x that you would consider unusual. Explain your reasoning.
Workplace Cleanliness Fifty-seven percent of employees judge their peers by the cleanliness of their workspaces. You randomly select 10 employees and ask them whether they judge their peers by the cleanliness of their workspaces. The random variable represents the number who judge their peers by the cleanliness of their workspaces. (Source: Adecco)