Textbook Question
Graph the functions in Exercises 23–26 in the ts-plane (t-axis horizontal, s-axis vertical). What is the period of each function? What symmetries do the graphs have?
s = −tan πt
 Verified step by step guidanceVerified video answer for a similar problem:
 5:53
5:53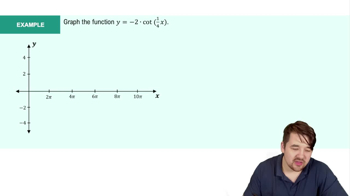 3:40
3:40 07:17
07:17 5:53m
5:53mMaster Graph of Sine and Cosine Function with a bite sized video explanation from Patrick
Start learning