Textbook Question
[Technology Exercise]
a. Graph y = cos x and y = sec x together for −3π/2 ≤ x ≤ 3π/2. Comment on the behavior of sec x in relation to the signs and values of cos x.
 Verified step by step guidanceVerified video answer for a similar problem:
 5:53
5:53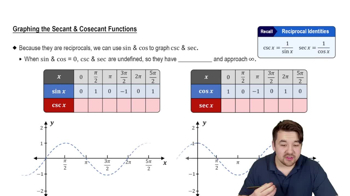 6:22
6:22 13:49
13:49 5:53m
5:53mMaster Graph of Sine and Cosine Function with a bite sized video explanation from Patrick
Start learning