Graph y = sin x and y = ⌊sin x⌋ together. What are the domain and range of ⌊sin x⌋?
Table of contents
- 0. Functions7h 55m
- Introduction to Functions18m
- Piecewise Functions10m
- Properties of Functions9m
- Common Functions1h 8m
- Transformations5m
- Combining Functions27m
- Exponent rules32m
- Exponential Functions28m
- Logarithmic Functions24m
- Properties of Logarithms36m
- Exponential & Logarithmic Equations35m
- Introduction to Trigonometric Functions38m
- Graphs of Trigonometric Functions44m
- Trigonometric Identities47m
- Inverse Trigonometric Functions48m
- 1. Limits and Continuity2h 2m
- 2. Intro to Derivatives1h 33m
- 3. Techniques of Differentiation3h 18m
- 4. Applications of Derivatives2h 38m
- 5. Graphical Applications of Derivatives6h 2m
- 6. Derivatives of Inverse, Exponential, & Logarithmic Functions2h 37m
- 7. Antiderivatives & Indefinite Integrals1h 26m
- 8. Definite Integrals4h 44m
- 9. Graphical Applications of Integrals2h 27m
- 10. Physics Applications of Integrals 3h 16m
- 11. Integrals of Inverse, Exponential, & Logarithmic Functions2h 31m
- 12. Techniques of Integration7h 41m
- 13. Intro to Differential Equations2h 55m
- 14. Sequences & Series5h 36m
- 15. Power Series2h 19m
- 16. Parametric Equations & Polar Coordinates7h 58m
0. Functions
Graphs of Trigonometric Functions
Problem 1.4.34
Textbook Question
Use graphing software to graph the functions specified in Exercises 31–36.
Select a viewing window that reveals the key features of the function.
Graph two periods of the function f (x) = 3 cot (x/2) + 1.
 Verified step by step guidance
1
Step 1: Understand the function f(x) = 3 cot(x/2) + 1. The cotangent function, cot(x), is the reciprocal of the tangent function, and it has vertical asymptotes where the tangent function is undefined. The coefficient 3 scales the amplitude, and the '+1' shifts the graph vertically by 1 unit.
Step 2: Identify the period of the function. The standard period of cot(x) is π. Since the argument of cotangent is scaled by 1/2 (x/2), the period of the function becomes 2π. This is because the period of cotangent is scaled by the reciprocal of the coefficient of x inside the function.
Step 3: Determine the key features of the function. The vertical asymptotes occur where the argument of cotangent is an integer multiple of π (i.e., x/2 = kπ, where k is an integer). Solve for x to find the asymptotes: x = 2kπ. The function also has zeros where the argument of cotangent is an odd multiple of π/2 (i.e., x/2 = (2k+1)π/2). Solve for x to find the zeros: x = (2k+1)π.
Step 4: Set up a viewing window for graphing. Since the period of the function is 2π, graph two periods by setting the x-axis range from -4π to 4π. Choose a y-axis range that accommodates the vertical shift and scaling, such as [-5, 5].
Step 5: Use graphing software to plot the function. Input f(x) = 3 cot(x/2) + 1 into the software, and adjust the viewing window to the specified range. Observe the key features, including the vertical asymptotes, zeros, and the vertical shift of the graph.
 Verified video answer for a similar problem:
This video solution was recommended by our tutors as helpful for the problem above
Video duration:
8mPlay a video:
0 Comments
Key Concepts
Here are the essential concepts you must grasp in order to answer the question correctly.
Cotangent Function
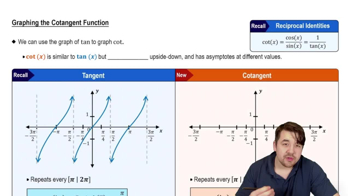
The cotangent function, denoted as cot(x), is the reciprocal of the tangent function. It is defined as cot(x) = cos(x)/sin(x). The graph of the cotangent function has vertical asymptotes where the sine function is zero, leading to periodic behavior with a period of π. Understanding its properties is essential for accurately graphing functions that involve cotangent.
Recommended video:

Introduction to Cotangent Graph
Transformations of Functions
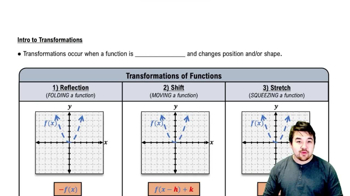
Transformations of functions involve shifting, stretching, or compressing the graph of a function. In the function f(x) = 3 cot(x/2) + 1, the '3' vertically stretches the graph by a factor of 3, while '+1' shifts the graph upward by 1 unit. The 'x/2' inside the cotangent function indicates a horizontal stretch, doubling the period of the function to 2π. Recognizing these transformations is crucial for accurately graphing the function.
Recommended video:

Intro to Transformations
Graphing Software
Graphing software allows users to visualize mathematical functions and their transformations interactively. It provides tools to set viewing windows, which define the range of x and y values displayed on the graph. Selecting an appropriate viewing window is vital to reveal key features of the function, such as intercepts, asymptotes, and periodic behavior, ensuring a comprehensive understanding of the function's characteristics.
Recommended video:

Graphing The Derivative

 5:53m
5:53mWatch next
Master Graph of Sine and Cosine Function with a bite sized video explanation from Patrick
Start learningRelated Videos
Related Practice
Textbook Question
