Here are the essential concepts you must grasp in order to answer the question correctly.
Trigonometric Functions
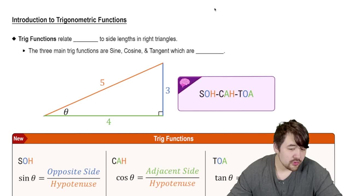
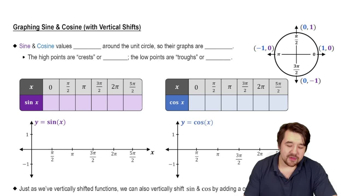
Trigonometric functions, such as sine and cosine, are fundamental periodic functions that describe relationships between angles and sides in triangles. The sine function, sin(x), represents the y-coordinate of a point on the unit circle, while the cosine function, cos(x), represents the x-coordinate. Understanding their properties, including amplitude, period, and phase shift, is essential for analyzing and graphing their combinations.
Recommended video:
Introduction to Trigonometric Functions
Graphing Functions
Graphing functions involves plotting points on a coordinate system to visualize the relationship between the input (x-values) and output (f(x) values). For trigonometric functions, this includes identifying key features such as intercepts, maxima, minima, and periodicity. Using graphing software allows for precise representation and manipulation of these functions, making it easier to observe their behavior over specified intervals.
Recommended video:
Graph of Sine and Cosine Function
Viewing Window
The viewing window in graphing software defines the range of x and y values displayed on the graph. Selecting an appropriate viewing window is crucial for revealing key features of the function, such as peaks, troughs, and periodicity. A well-chosen window allows for a comprehensive understanding of the function's behavior, ensuring that important characteristics are not overlooked.
Recommended video: