Here are the essential concepts you must grasp in order to answer the question correctly.
Graphing Functions
Graphing functions involves plotting points on a coordinate system to visualize the relationship between variables. In this case, the functions are plotted in the ts-plane, where 't' is on the horizontal axis and 's' on the vertical axis. Understanding how to interpret the graph helps in analyzing the behavior of the function, including its periodicity and symmetries.
Recommended video:
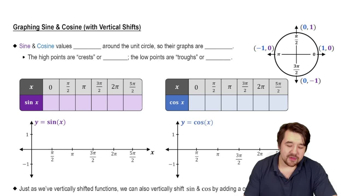
Graph of Sine and Cosine Function
Periodicity
The period of a function is the length of the interval over which the function repeats itself. For trigonometric functions like tangent, the period can be determined from the function's formula. In the case of s = -tan(πt), the period is π, meaning the function will repeat its values every π units along the t-axis.
Recommended video:
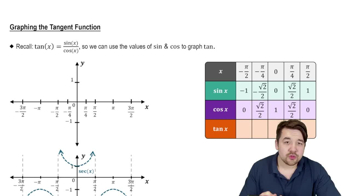
Introduction to Tangent Graph
Symmetry in Graphs
Symmetry in graphs refers to the property where a graph remains unchanged under certain transformations, such as reflection. For the function s = -tan(πt), it exhibits odd symmetry, meaning it is symmetric about the origin. This characteristic can be identified by checking if f(-t) = -f(t) holds true for the function.
Recommended video: