Here are the essential concepts you must grasp in order to answer the question correctly.
Graphing Functions
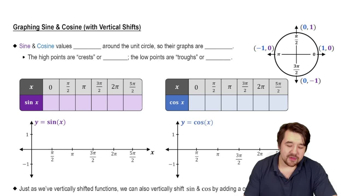
Graphing functions involves plotting points on a coordinate system to visually represent the relationship between the input (x-values) and output (f(x)-values). Understanding how to graph functions is essential for analyzing their behavior, identifying key features such as intercepts, maxima, minima, and periodicity.
Recommended video:
Graph of Sine and Cosine Function
Key Features of Functions
Key features of functions include critical points, intercepts, and asymptotes, which provide insight into the function's behavior. For periodic functions like sine, understanding amplitude, period, and phase shift is crucial for accurately representing the function's shape and characteristics on a graph.
Recommended video:
Viewing Windows in Graphing
A viewing window in graphing software defines the range of x and y values displayed on the graph. Selecting an appropriate viewing window is vital to ensure that all significant features of the function are visible, allowing for a comprehensive analysis of its behavior over the specified interval.
Recommended video: