Multiple Choice
Based on the graph of , describe the graph of the derivative at the point .
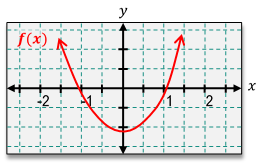
Below the x-axis
Above the x-axis
On the x-axis
 Verified step by step guidance
 6:15m
6:15mMaster Graphing The Derivative with a bite sized video explanation from Patrick
Start learning
