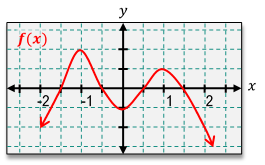
Join thousands of students who trust us to help them ace their exams!Watch the first video
Multiple Choice
Based on the graph of f(x), describe where the derivative curve f′(x) would be below the x-axis.
A
(-∞,-1) U (0,1)
B
(-1,0) U (1,∞)
C
(-∞, -1) U (1,∞)
D
(-1,1)
Verified step by step guidance
1
Step 1: Recall that the derivative f′(x) represents the slope of the tangent line to the graph of f(x) at any given point. When f′(x) is below the x-axis, the slope of f(x) is negative, meaning the graph of f(x) is decreasing.
Step 2: Analyze the graph of f(x). Identify the intervals where the graph is decreasing. These intervals occur between turning points where the slope transitions from positive to negative or vice versa.
Step 3: Observe the graph. The function f(x) is decreasing in the intervals (-1, 0) and (1, ∞). In these intervals, the slope of f(x) is negative, so f′(x) would be below the x-axis.
Step 4: Note that the derivative curve f′(x) is not directly visible, but its behavior can be inferred from the graph of f(x). The intervals where f′(x) is below the x-axis correspond to the decreasing portions of f(x).
Step 5: Conclude that the correct intervals where f′(x) is below the x-axis are (-1, 0) U (1, ∞). This matches the behavior of the graph of f(x) as observed.