Back
BackProblem 3.q.9
Estimating s The sample of 92 roller coaster maximum speeds includes values ranging from a low of 10 km/h to a high of 194 km/h. Use the range rule of thumb to estimate the standard deviation.
Problem 3.q.4
Variance of Roller Coaster Speeds The standard deviation of the sample values in Exercise 1 is 43.1 km/h. What is the variance (including units)?
Problem 3.r.1h
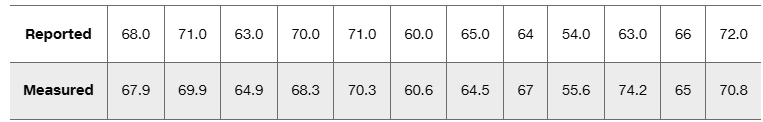
Reported and Measured Heights Listed below are self-reported heights of males aged 16 and over and their corresponding measured heights (based on data from the National Health and Nutrition Examination Survey). All heights are in inches. First find the differences (reported height–measured height), and then use those differences to find the (h) Q1, (i) Q3
Problem 3.r.1a
Reported and Measured Heights Listed below are self-reported heights of males aged 16 and over and their corresponding measured heights (based on data from the National Health and Nutrition Examination Survey). All heights are in inches. First find the differences (reported height–measured height), and then use those differences to find the (a) mean, (b) median, (c) mode,
Problem 3.r.2
Outliers Identify any of the differences found from Exercise 1 that appear to be outliers. For any outliers, how much of an effect do they have on the mean, median, and standard deviation?
Problem 3.r.8
Estimating Standard Deviation Listed below are sorted weights (g) of a sample of M&M plain candies randomly selected from one bag. Use the range rule of thumb to estimate the value of the standard deviation of all 345 M&Ms in the bag. Compare the result to the standard deviation of 0.0366 g computed from all of the 345 M&Ms in the bag.