Outliers Identify any of the differences found from Exercise 1 that appear to be outliers. For any outliers, how much of an effect do they have on the mean, median, and standard deviation?
Verified step by step guidance
1
Step 1: Begin by identifying the dataset from Exercise 1. Review the differences provided and calculate the interquartile range (IQR). The IQR is calculated as the difference between the third quartile (Q3) and the first quartile (Q1). Use the formula: .
Step 2: Determine the lower and upper bounds for identifying outliers. Use the formulas: and . Any data points outside these bounds are considered outliers.
Step 3: Identify the outliers in the dataset by comparing each data point to the lower and upper bounds calculated in Step 2. List the values that fall outside these bounds.
Step 4: Analyze the effect of the outliers on the mean, median, and standard deviation. For the mean, note that outliers can significantly shift the average because the mean is sensitive to extreme values. For the median, outliers typically have less impact since the median is based on the middle value of the dataset. For the standard deviation, outliers increase the spread of the data, leading to a higher standard deviation.
Step 5: To quantify the effect, recalculate the mean, median, and standard deviation with and without the outliers. Compare the results to observe the changes caused by the outliers.
Verified video answer for a similar problem:
This video solution was recommended by our tutors as helpful for the problem above
Video duration:
6m
Play a video:
Was this helpful?
Key Concepts
Here are the essential concepts you must grasp in order to answer the question correctly.
Outliers
Outliers are data points that differ significantly from other observations in a dataset. They can arise due to variability in the data or may indicate measurement error. Identifying outliers is crucial as they can skew statistical analyses, particularly measures of central tendency like the mean and median, and can also affect the standard deviation, which measures data dispersion.
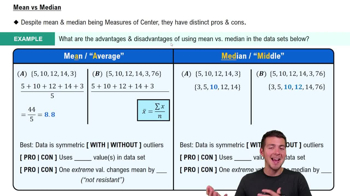
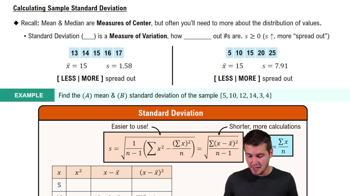
The mean is the average of a dataset, calculated by summing all values and dividing by the number of observations. The median is the middle value when data is ordered, providing a measure that is less affected by outliers. Standard deviation quantifies the amount of variation or dispersion in a set of values, indicating how spread out the data points are around the mean.
Outliers can significantly influence the mean, often pulling it in their direction, which may not represent the central tendency of the data accurately. The median, being a robust measure, remains relatively unaffected by outliers, making it a better indicator of central tendency in skewed distributions. Standard deviation can also increase due to outliers, suggesting greater variability in the dataset than may actually exist.