Back
BackProblem 9.2.12
"In Exercises 7-12, match the description in the left column with its symbol(s) in the right column.
12. The point a regression line always passes through
a. \hat{y}_i
b. y_i
c. b
d. (\bar{x}, \bar{y})
e. m
f. \bar{y}"
Problem 9.1.8
8. In your own words, what does it mean to say "correlation does not imply causation"? List a pair of variables that have correlation but no cause-and-effect relationship.
Problem 9.3.24
"Constructing and Interpreting a Prediction Interval In Exercises 21-30, construct the indicated prediction interval and interpret the results.
24. Trees Construct a 90% prediction interval for the trunk diameter of a tree in Exercise 14 when the height is 80 feet."
Problem 9.1.13
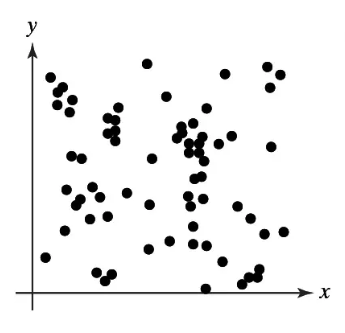
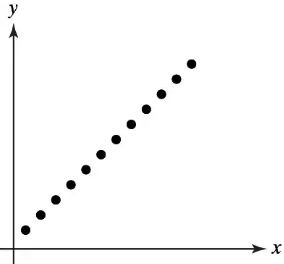
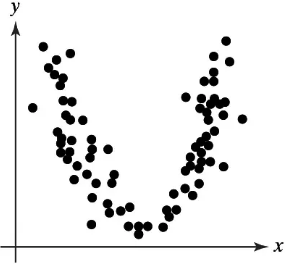
Graphical Analysis In Exercises 11–14, determine whether there is a perfect positive linear correlation, a strong positive linear correlation, a perfect negative linear correlation, a strong negative linear correlation, or no linear correlation between the variables.
Problem 9.3.6
Two variables have a bivariate normal distribution. Explain what this means.
Problem 9.4.6
"Predicting y-Values In Exercises 3-6, use the multiple regression equation to predict the y-values for the values of the independent variables.
6. Elephant Weight The equation used to predict the weight of an elephant (in kilograms) is
y =- 4016+11.5x_1+7.55x_2+12.5x_3
where x_1 represents the girth of the elephant (in centimeters), x_2 represents the length of the elephant (in centimeters), and x_3 represents the circumference of a footpad (in
centimeters). (Source: Field Trip Earth)
a. x_1 = 421, x_2 = 224, x_3 = 144
b. x_1 = 311, x_2 = 171, x_3 = 102
c. x_1 = 376, x_2 = 226, x_3 = 124
d. x_1 =231, x_2 = 135, x_3 = 86"
Problem 9.2.7
"In Exercises 7-12, match the description in the left column with its symbol(s) in the right column.
7. The y-value of a data point corresponding to x;
a. \hat{y}_i
b. y_i
c. b
d. (\bar{x}, \bar{y})
e. m
f. \bar{y}"
Problem 9.3.5
What is the coefficient of determination for two variables that have perfect positive linear correlation or perfect negative linear correlation? Interpret your answer.
Problem 9.3.29
"Constructing and Interpreting a Prediction Interval In Exercises 21-30, construct the indicated prediction interval and interpret the results.
29. New Vehicle Sales Construct a 95% prediction interval for new vehicle sales for General Motors in Exercise 19 when the number of new vehicles sold by Ford is 2028 thousand."
Problem 9.4.5
"Predicting y-Values In Exercises 3-6, use the multiple regression equation to predict the y-values for the values of the independent variables.
5. Black Cherry Tree Volume The volume (in cubic feet) of a black cherry tree can be modeled by the equation
y =- 52.2+0.3x_1 +4.5x_2
where x_1 is the tree's height (in feet) and x_2 is the tree's diameter (in inches). (Source: Journal of the Royal Statistical Society)
a. x_1 = 70, x_2 = 8.6
b. x_1 = 65, x_2 = 11.0
c. x_1 = 83, x_2 = 17.6
d. x_1 = 87, x_2 = 19.6"
Problem 9.1.16
"In Exercises 13-16, use the value of the correlation coefficient r to calculate the coefficient of determination r^2. What does this tell you about the explained variation of the data about the regression line? about the unexplained variation?
16. r = 0.795"
Problem 9.1.10
"In Exercises 9 and 10, identify the explanatory variable and the response variable.
10. An actuary at an insurance company wants to determine whether the number of hours of safety driving classes can be used to predict the number of driving accidents for each
driver."
Problem 9.3.21
"Constructing and Interpreting a Prediction Interval In Exercises 21-30, construct the indicated prediction interval and interpret the results.
21. Proceeds Construct a 95% prediction interval for the proceeds from initial public offerings in Exercise 11 when the number of offerings is 200."
Problem 9.1.14
Graphical Analysis In Exercises 11–14, determine whether there is a perfect positive linear correlation, a strong positive linear correlation, a perfect negative linear correlation, a strong negative linear correlation, or no linear correlation between the variables.
Problem 9.1.20
"In Exercises 19-22, two variables are given that have been shown to have correlation but no cause-and-effect relationship. Describe at least one possible reason for the correlation.
20. Alcohol use and tobacco use"
Problem 9.3.26
"Constructing and Interpreting a Prediction Interval In Exercises 21-30, construct the indicated prediction interval and interpret the results.
26. Voter Turnout Construct a 99% prediction interval for number of ballots cast in Exercise 16 when the voting age population is 210 million."
Problem 9.3.31
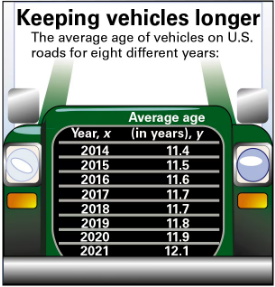
"Old Vehicles In Exercises 31–34, use the figure shown at the left.
Scatter Plot Construct a scatter plot of the data. Show y and x on the graph."
Problem 9.3.10
"In Exercises 7-10, use the value of the correlation coefficient r to calculate the coefficient of determination r^2. What does this tell you about the explained variation of the data about the regression line? about the unexplained variation?
10. r =0.881"
Problem 9.2.3
3. Explain how to predict y-values using the equation of a regression line.
Problem 9.2.1
1. What is a residual? Explain when a residual is positive, negative, and zero.
Problem 9.3.32
"Old Vehicles In Exercises 31–34, use the figure shown at the left.
Regression Line Find and draw the regression line."
Problem 9.3.2
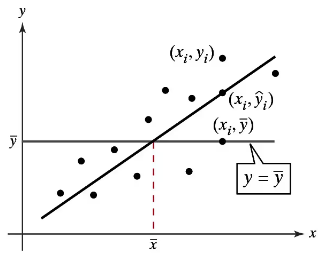
"Graphical Analysis In Exercises 1–3, use the figure.
2. Describe the explained variation about a regression line in words and in symbols."
Problem 9.2.2
2. Two variables have a positive linear correlation. Is the slope of the regression line for the variables positive or negative?
Problem 9.2.6
6. Why is it not appropriate to use a regression line to predict y-values for x-values that are not in (or close to) the range of x-values found in the data?
Problem 9.3.22
"Constructing and Interpreting a Prediction Interval In Exercises 21-30, construct the indicated prediction interval and interpret the results.
22. Mean Hourly Wage Construct a 95% prediction interval for the mean hourly wage in Exercise 12 when the median hourly wage is $21.50."
Problem 9.1.12
Graphical Analysis In Exercises 11–14, determine whether there is a perfect positive linear correlation, a strong positive linear correlation, a perfect negative linear correlation, a strong negative linear correlation, or no linear correlation between the variables.
Problem 9.3.30
"Constructing and Interpreting a Prediction Interval In Exercises 21-30, construct the indicated prediction interval and interpret the results.
30. New Vehicle Sales Construct a 99% prediction interval for new vehicle sales for Honda in Exercise 20 when the number of new vehicles sold by Toyota is 2159 thousand."
Problem 9.3.34
"Old Vehicles In Exercises 31–34, use the figure shown at the left.
Error of Estimate Find the standard error of estimate Se and interpret the results."
Problem 9.3.4
The coefficient of determination r^2 is the ratio of which two types of variations? What does r^2 measure? What does 1 - r^2 measure?
Problem 9.4.2
2. Compare the numbers of dependent and independent variables in a multiple regression equation and a single regression equation.