Back
BackProblem 9.1.3
3. What does the sample correlation coefficient r measure? Which value indicates a stronger correlation: r =0.918 or r =- 0.932? Explain your reasoning.
Problem 9.1.6
6. Discuss the difference between r and p.
Problem 9.1.16
"In Exercises 13-16, use the value of the correlation coefficient r to calculate the coefficient of determination r^2. What does this tell you about the explained variation of the data about the regression line? about the unexplained variation?
16. r = 0.795"
Problem 9.1.11
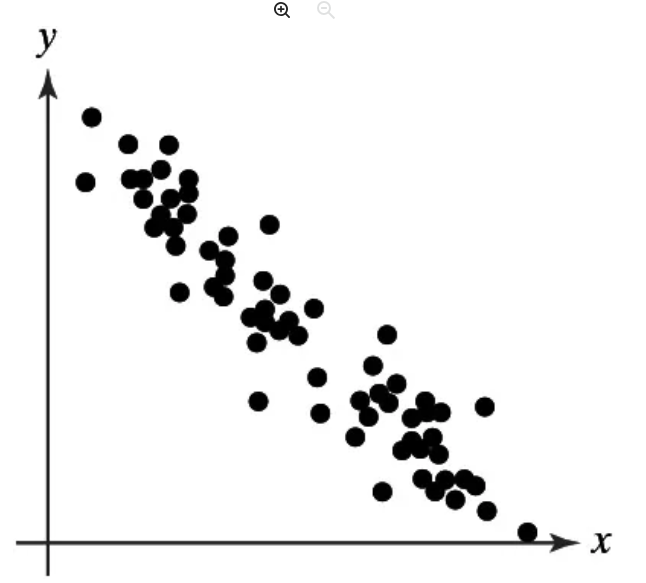
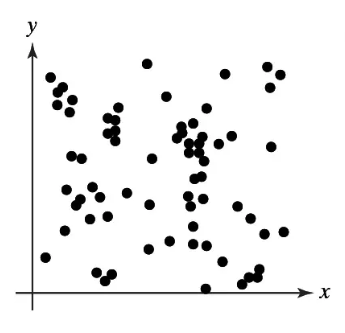
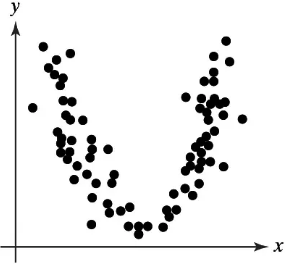
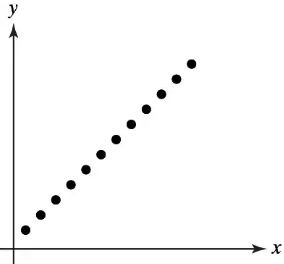
Graphical Analysis In Exercises 11–14, determine whether there is a perfect positive linear correlation, a strong positive linear correlation, a perfect negative linear correlation, a strong negative linear correlation, or no linear correlation between the variables.
Problem 9.1.13
Graphical Analysis In Exercises 11–14, determine whether there is a perfect positive linear correlation, a strong positive linear correlation, a perfect negative linear correlation, a strong negative linear correlation, or no linear correlation between the variables.
Problem 9.1.20
"In Exercises 19-22, two variables are given that have been shown to have correlation but no cause-and-effect relationship. Describe at least one possible reason for the correlation.
20. Alcohol use and tobacco use"
Problem 9.1.4
4. Give examples of two variables that have perfect positive linear correlation and two variables that have perfect negative linear correlation.
Problem 9.1.12
Graphical Analysis In Exercises 11–14, determine whether there is a perfect positive linear correlation, a strong positive linear correlation, a perfect negative linear correlation, a strong negative linear correlation, or no linear correlation between the variables.
Problem 9.1.14
Graphical Analysis In Exercises 11–14, determine whether there is a perfect positive linear correlation, a strong positive linear correlation, a perfect negative linear correlation, a strong negative linear correlation, or no linear correlation between the variables.
Problem 9.1.38a
Writing Use an appropriate research source to find a real-life data set with the indicated cause-and-effect relationship. Write a paragraph describing each variable and explain why you think the variables have the indicated cause-and-effect relationship.
a. Direct Cause-and-Effect: Changes in one variable cause changes in the other variable.
Problem 9.1.38b
Writing Use an appropriate research source to find a real-life data set with the indicated cause-and-effect relationship. Write a paragraph describing each variable and explain why you think the variables have the indicated cause-and-effect relationship.
b. Other Factors: The relationship between the variables is caused by a third variable.
Problem 9.1.38c
Writing Use an appropriate research source to find a real-life data set with the indicated cause-and-effect relationship. Write a paragraph describing each variable and explain why you think the variables have the indicated cause-and-effect relationship.
c. Coincidence: The relationship between the variables is a coincidence.
Problem 9.1.29
In Exercise 23, add data for a child who is 6 years old and has a vocabulary of 900 words. Describe how this affects the correlation coefficient r.
Problem 9.1.30
In Exercise 24, remove the data for the student who is 57 inches tall and scored 128 on the IQ test. Describe how this affects the correlation coefficient r.
Problem 9.1.31
In Exercise 25, remove the data for the international soccer player with a maximum weight of 170 kilograms and a jump height of 64 centimeters. Describe how this affects the correlation coefficient r.
Problem 9.1.32
In Exercise 26, add data for an international soccer player who can perform the half squat with a maximum of 210 kilograms and can sprint 10 meters in 2.00 seconds. Describe how this affects the correlation coefficient r.
Problem 9.1.10
"In Exercises 9 and 10, identify the explanatory variable and the response variable.
10. An actuary at an insurance company wants to determine whether the number of hours of safety driving classes can be used to predict the number of driving accidents for each
driver."
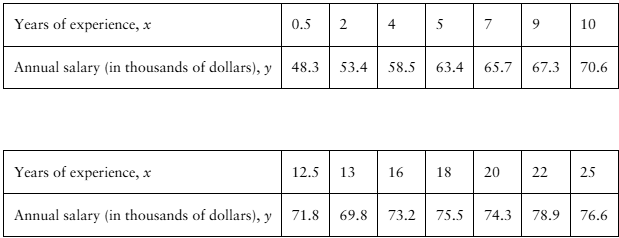
Problem 9.2.27
"[APPLET] Registered Nurse Salaries In Exercises 27–30, use the table, which shows the years of experience of 14 registered nurses and their annual salaries (in thousands of dollars). (Adapted from Payscale, Inc.)
27. Correlation Using the scatter plot of the registered nurse salary data shown below, what type of correlation, if any, do you think the data have? Explain.
"
Problem 9.2.2
2. Two variables have a positive linear correlation. Is the slope of the regression line for the variables positive or negative?
Problem 9.2.5
5. To predict y-values using the equation of a regression line, what must be true about the correlation coefficient of the variables?
Problem 9.2.7
"In Exercises 7-12, match the description in the left column with its symbol(s) in the right column.
7. The y-value of a data point corresponding to x;
a. \hat{y}_i
b. y_i
c. b
d. (\bar{x}, \bar{y})
e. m
f. \bar{y}"
Problem 9.2.9
"In Exercises 7-12, match the description in the left column with its symbol(s) in the right column.
9. Slope
a. \hat{y}_i
b. y_i
c. b
d. (\bar{x}, \bar{y})
e. m
f. \bar{y}"
Problem 9.2.12
"In Exercises 7-12, match the description in the left column with its symbol(s) in the right column.
12. The point a regression line always passes through
a. \hat{y}_i
b. y_i
c. b
d. (\bar{x}, \bar{y})
e. m
f. \bar{y}"
Problem 9.2.1
1. What is a residual? Explain when a residual is positive, negative, and zero.
Problem 9.2.3
3. Explain how to predict y-values using the equation of a regression line.
Problem 9.2.4
4. For a set of data and a corresponding regression line, describe all values of x that provide meaningful predictions for y.
Problem 9.2.10
"In Exercises 7-12, match the description in the left column with its symbol(s) in the right column.
10. y-intercept
a. \hat{y}_i
b. y_i
c. b
d. (\bar{x}, \bar{y})
e. m
f. \bar{y}"
Problem 9.2.6
6. Why is it not appropriate to use a regression line to predict y-values for x-values that are not in (or close to) the range of x-values found in the data?
Problem 9.3.6
Two variables have a bivariate normal distribution. Explain what this means.
Problem 9.3.4
The coefficient of determination r^2 is the ratio of which two types of variations? What does r^2 measure? What does 1 - r^2 measure?