2. Describing Data with Tables and Graphs
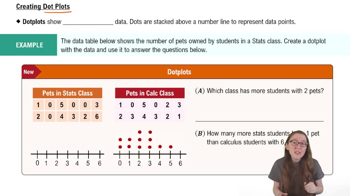
Dot Plots
 04:01
04:01
Practice this topic
- Multiple Choice
The dotplot below shows the number of books read in a month by students in a college class. Find the most and least frequent number of books read.
- Multiple Choice
Compare the two dotplots, which give the number of siblings students have in Class A and Class B. Which class has more students with 2 siblings?
- Textbook Question
Graphing Data Sets In Exercises 17–32, organize the data using the indicated type of graph. Describe any patterns.
Life Spans of Houseflies Use a dot plot to display the data, which represent the life spans (in days) of 30 houseflies.
9 9 4 11 10 5 13 9 7 11 6 8 14 10 6
10 10 7 14 11 7 8 6 13 10 14 14 8 13 10
- Textbook Question
Phone Screen Sizes Display the data below in a dot plot. Describe the differences in how the stem-and-leaf plot and the dot plot show patterns in the data.
- Textbook Question
The heights (in feet) and the number of stories of the ten tallest buildings in New York City are listed. Use a scatter plot to display the data. Describe any patterns. (Source: Emporis)
- Textbook Question
The data set represents the number of minutes a sample of 27 people exercise each week.
108 139 120 123 120 132 123 131 131
157 150 124 111 101 135 119 116 117
127 128 139 119 118 114 127 142 130
g. Display the data using a box-and-whisker plot.