Textbook Question
Determine whether the statement is true or false. If it is false, rewrite it as a true statement.
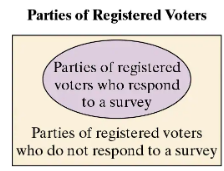
A sample statistic will not change from sample to sample.
1
views
 Verified step by step guidanceVerified video answer for a similar problem:
 04:48
04:48 05:11
05:11 5:14
5:14 2:13m
2:13mMaster Introduction to Statistics Channel with a bite sized video explanation from Patrick
Start learning