Here are the essential concepts you must grasp in order to answer the question correctly.
Population
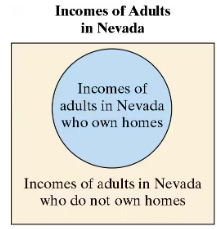
In statistics, the population refers to the entire group of individuals or items that share a common characteristic. In the context of the Venn diagram, the population consists of all adults in Nevada, encompassing both homeowners and non-homeowners. Understanding the population is crucial for making generalizations and drawing conclusions from a sample.
Recommended video:
Population Standard Deviation Known
Sample
A sample is a subset of the population selected for analysis, intended to represent the larger group. In the Venn diagram, the sample could be the incomes of a specific group of adults in Nevada who own homes or do not own homes. Analyzing a sample allows researchers to make inferences about the population without needing to study every individual.
Recommended video:
Sampling Distribution of Sample Proportion
Venn Diagram
A Venn diagram is a visual tool used to illustrate the relationships between different sets. In this case, it shows the overlap between the incomes of adults in Nevada who own homes and those who do not. This representation helps clarify how the sample and population are related, making it easier to identify which groups are included in the analysis.
Recommended video:
Probability of Mutually Exclusive Events