Multiple Choice
Sketch a graph to represent the probability, then use a calculator to find it.
 Verified step by step guidanceVerified video answer for a similar problem:
 06:06
06:06 5:37
5:37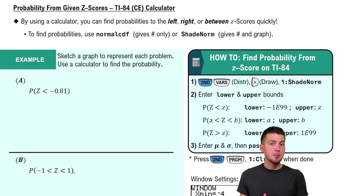 07:09
07:09 7:09m
7:09mMaster Probability From Given Z-Scores - TI-84 (CE) Calculator with a bite sized video explanation from Patrick
Start learning