Here are the essential concepts you must grasp in order to answer the question correctly.
Continuous Uniform Distribution
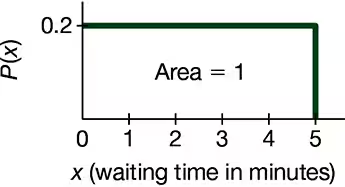
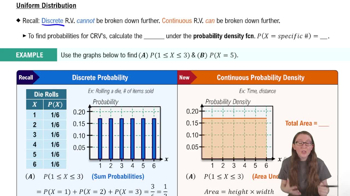
A continuous uniform distribution is a probability distribution where all outcomes in a specified range are equally likely. The distribution is defined by two parameters, a and b, which represent the minimum and maximum values. The probability density function (PDF) is constant between these limits, and the total area under the curve equals 1, indicating that the total probability of all outcomes is 100%.
Recommended video:
Probability Density Function (PDF)
The probability density function (PDF) describes the likelihood of a continuous random variable taking on a specific value. For a continuous uniform distribution, the PDF is a horizontal line, indicating that the probability is evenly distributed across the range. The height of the PDF is calculated as 1 divided by the range (b - a), ensuring that the area under the curve equals 1, which represents the total probability.
Recommended video:
Introduction to Probability
Calculating Probability
To find the probability of a continuous random variable falling within a specific range, you calculate the area under the PDF over that interval. For a continuous uniform distribution, this is done by multiplying the height of the PDF by the width of the interval. For example, to find the probability that the waiting time is between 2 and 3 minutes, you would calculate the area of the rectangle formed by these limits, which is the height (0.2) times the width (1).
Recommended video:
Probability From Given Z-Scores - TI-84 (CE) Calculator