Here are the essential concepts you must grasp in order to answer the question correctly.
Outliers
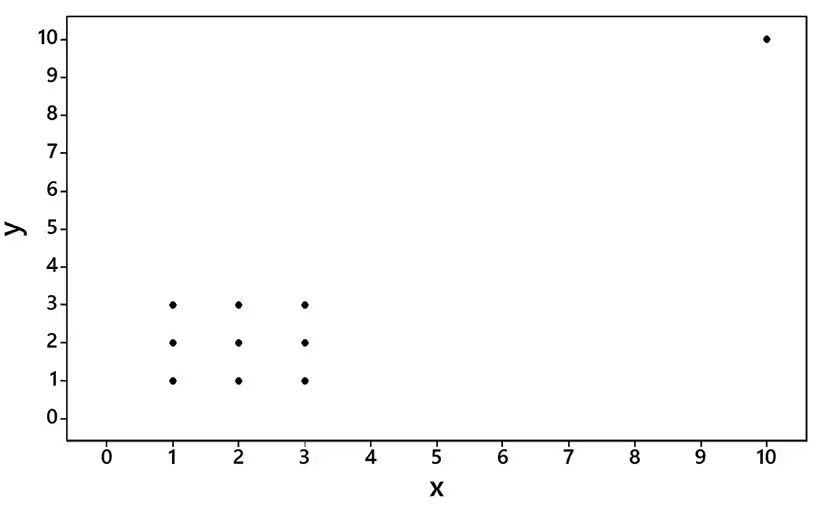
Outliers are data points that differ significantly from other observations in a dataset. They can occur due to variability in the data or may indicate experimental errors. In scatterplots, outliers can skew the results of statistical analyses, such as correlation, and may need to be addressed to ensure accurate interpretations.
Recommended video:
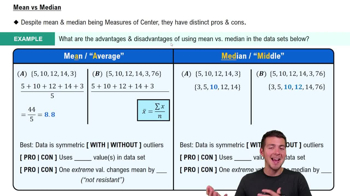
Comparing Mean vs. Median
Correlation Coefficient (r)
The correlation coefficient, denoted as 'r', quantifies the strength and direction of a linear relationship between two variables. Its value ranges from -1 to 1, where 1 indicates a perfect positive correlation, -1 indicates a perfect negative correlation, and 0 indicates no correlation. Understanding 'r' is crucial for assessing how closely related the variables are in the scatterplot.
Recommended video:
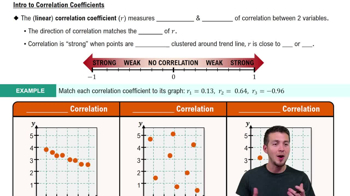
Linear Correlation
Linear correlation refers to the relationship between two variables that can be represented by a straight line. It is assessed using the correlation coefficient 'r'. A strong linear correlation suggests that changes in one variable are associated with changes in another, while a weak correlation indicates little to no relationship. Identifying linear correlation is essential for making predictions based on the data.
Recommended video: