Here are the essential concepts you must grasp in order to answer the question correctly.
Normal Distribution
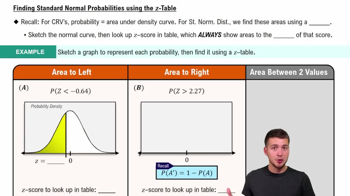
Normal distribution is a probability distribution that is symmetric about the mean, showing that data near the mean are more frequent in occurrence than data far from the mean. It is characterized by its bell-shaped curve, defined by its mean and standard deviation. In this context, the mean is 0 and the standard deviation is 1, which allows for the application of the empirical rule.
Recommended video:
Finding Standard Normal Probabilities using z-Table
Standard Deviation
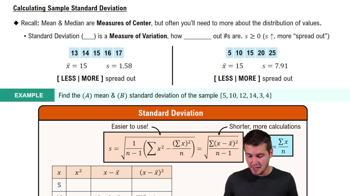
Standard deviation is a measure of the amount of variation or dispersion in a set of values. A low standard deviation indicates that the values tend to be close to the mean, while a high standard deviation indicates that the values are spread out over a wider range. In this question, scores that are less than 2 standard deviations from the mean (between -2 and 2) are considered not significant.
Recommended video:
Calculating Standard Deviation
Empirical Rule
The empirical rule, also known as the 68-95-99.7 rule, states that for a normal distribution, approximately 68% of the data falls within one standard deviation of the mean, about 95% falls within two standard deviations, and about 99.7% falls within three standard deviations. This rule helps in determining the percentage of scores that are not significant, as it indicates that roughly 95% of scores will lie within 2 standard deviations from the mean.
Recommended video:
Probability of Mutually Exclusive Events