Here are the essential concepts you must grasp in order to answer the question correctly.
Confidence Interval
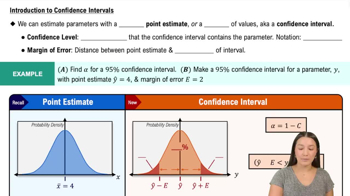
A confidence interval is a range of values, derived from sample statistics, that is likely to contain the true population parameter. It provides an estimate of uncertainty around a sample mean or proportion. The width of the interval depends on the sample size and variability, and it is typically expressed at a certain confidence level, such as 95%.
Recommended video:
Introduction to Confidence Intervals
Student's t-distribution
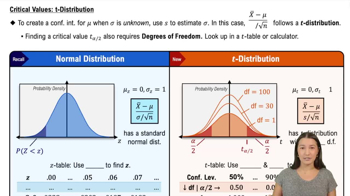
The Student's t-distribution is a probability distribution used when estimating population parameters when the sample size is small and the population standard deviation is unknown. It is similar to the normal distribution but has heavier tails, which accounts for the increased variability expected in smaller samples. This makes it particularly useful for constructing confidence intervals and hypothesis testing in such scenarios.
Recommended video:
Critical Values: t-Distribution
Skewed Distribution
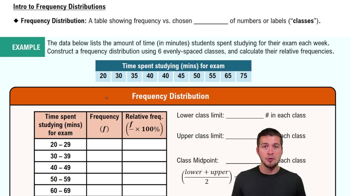
A skewed distribution is one where the data points are not symmetrically distributed around the mean, leading to a longer tail on one side. In a right-skewed distribution, for example, the majority of values cluster on the left, with a few larger values stretching the tail to the right. Understanding the skewness of data is crucial for selecting appropriate statistical methods, as it can affect the validity of assumptions underlying certain tests.
Recommended video:
Intro to Frequency Distributions