Discarded Plastic Find the test statistic used for the hypothesis test described in Exercise 1.
Table of contents
- 1. Intro to Stats and Collecting Data1h 14m
- 2. Describing Data with Tables and Graphs1h 56m
- 3. Describing Data Numerically2h 5m
- 4. Probability2h 16m
- 5. Binomial Distribution & Discrete Random Variables3h 6m
- 6. Normal Distribution and Continuous Random Variables2h 11m
- 7. Sampling Distributions & Confidence Intervals: Mean3h 23m
- Sampling Distribution of the Sample Mean and Central Limit Theorem19m
- Distribution of Sample Mean - Excel23m
- Introduction to Confidence Intervals15m
- Confidence Intervals for Population Mean1h 18m
- Determining the Minimum Sample Size Required12m
- Finding Probabilities and T Critical Values - Excel28m
- Confidence Intervals for Population Means - Excel25m
- 8. Sampling Distributions & Confidence Intervals: Proportion2h 10m
- 9. Hypothesis Testing for One Sample5h 8m
- Steps in Hypothesis Testing1h 6m
- Performing Hypothesis Tests: Means1h 4m
- Hypothesis Testing: Means - Excel42m
- Performing Hypothesis Tests: Proportions37m
- Hypothesis Testing: Proportions - Excel27m
- Performing Hypothesis Tests: Variance12m
- Critical Values and Rejection Regions28m
- Link Between Confidence Intervals and Hypothesis Testing12m
- Type I & Type II Errors16m
- 10. Hypothesis Testing for Two Samples5h 37m
- Two Proportions1h 13m
- Two Proportions Hypothesis Test - Excel28m
- Two Means - Unknown, Unequal Variance1h 3m
- Two Means - Unknown Variances Hypothesis Test - Excel12m
- Two Means - Unknown, Equal Variance15m
- Two Means - Unknown, Equal Variances Hypothesis Test - Excel9m
- Two Means - Known Variance12m
- Two Means - Sigma Known Hypothesis Test - Excel21m
- Two Means - Matched Pairs (Dependent Samples)42m
- Matched Pairs Hypothesis Test - Excel12m
- Two Variances and F Distribution29m
- Two Variances - Graphing Calculator16m
- 11. Correlation1h 24m
- 12. Regression3h 33m
- Linear Regression & Least Squares Method26m
- Residuals12m
- Coefficient of Determination12m
- Regression Line Equation and Coefficient of Determination - Excel8m
- Finding Residuals and Creating Residual Plots - Excel11m
- Inferences for Slope31m
- Enabling Data Analysis Toolpak1m
- Regression Readout of the Data Analysis Toolpak - Excel21m
- Prediction Intervals13m
- Prediction Intervals - Excel19m
- Multiple Regression - Excel29m
- Quadratic Regression15m
- Quadratic Regression - Excel10m
- 13. Chi-Square Tests & Goodness of Fit2h 21m
- 14. ANOVA2h 28m
9. Hypothesis Testing for One Sample
Steps in Hypothesis Testing
Problem 9.3.12a
Textbook Question
In Exercises 5–16, use the listed paired sample data, and assume that the samples are simple random samples and that the differences have a distribution that is approximately normal.
Heights of Presidents A popular theory is that presidential candidates have an advantage if they are taller than their main opponents. Listed are heights (cm) of presidents along with the heights of their main opponents (from Data Set 22 “Presidents” in Appendix B).
a. Use the sample data with a 0.05 significance level to test the claim that for the population of heights of presidents and their main opponents, the differences have a mean greater than 0 cm.

 Verified step by step guidance
1
Step 1: Calculate the differences between the heights of presidents and their main opponents for each pair. For example, for the first pair, the difference is 185 - 171 = 14 cm. Repeat this for all pairs in the dataset.
Step 2: Compute the mean of the differences obtained in Step 1. This involves summing all the differences and dividing by the number of pairs.
Step 3: Compute the standard deviation of the differences. Use the formula for standard deviation: \( \sigma = \sqrt{\frac{\sum (x_i - \bar{x})^2}{n-1}} \), where \( x_i \) are the individual differences, \( \bar{x} \) is the mean of the differences, and \( n \) is the number of pairs.
Step 4: Perform a one-sample t-test to test the claim that the mean difference is greater than 0. The test statistic is calculated using \( t = \frac{\bar{x} - \mu}{s / \sqrt{n}} \), where \( \bar{x} \) is the sample mean, \( \mu \) is the hypothesized mean (0 in this case), \( s \) is the sample standard deviation, and \( n \) is the sample size.
Step 5: Compare the calculated t-value from Step 4 to the critical t-value at a significance level of 0.05 and degrees of freedom \( n-1 \). If the calculated t-value is greater than the critical t-value, reject the null hypothesis and conclude that the mean difference is greater than 0 cm.
 Verified video answer for a similar problem:
This video solution was recommended by our tutors as helpful for the problem above
Video duration:
6mPlay a video:
0 Comments
Key Concepts
Here are the essential concepts you must grasp in order to answer the question correctly.
Paired Sample Data
Paired sample data involves two related groups where each member of one group is matched with a member of another group. In this context, the heights of presidents and their main opponents are paired, allowing for a direct comparison of their heights. This method is useful for controlling variability and focusing on the differences between the two related samples.
Recommended video:

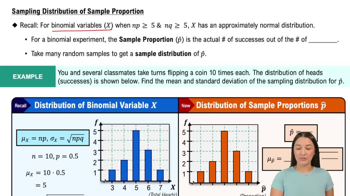
Sampling Distribution of Sample Proportion
Hypothesis Testing
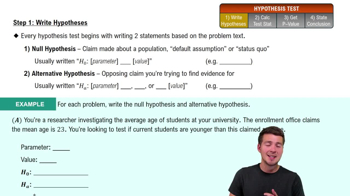
Hypothesis testing is a statistical method used to determine if there is enough evidence to reject a null hypothesis in favor of an alternative hypothesis. In this case, the null hypothesis states that the mean difference in heights is less than or equal to 0 cm, while the alternative hypothesis posits that the mean difference is greater than 0 cm. The significance level of 0.05 indicates the threshold for determining statistical significance.
Recommended video:
Guided course

Step 1: Write Hypotheses
Normal Distribution
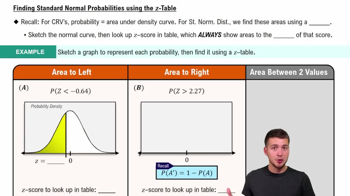
Normal distribution is a probability distribution that is symmetric about the mean, indicating that data near the mean are more frequent in occurrence than data far from the mean. The assumption that the differences in heights are approximately normally distributed is crucial for applying certain statistical tests, such as the t-test, which relies on this property to make inferences about the population from the sample data.
Recommended video:
Guided course

Finding Standard Normal Probabilities using z-Table

 6:21m
6:21mWatch next
Master Step 1: Write Hypotheses with a bite sized video explanation from Patrick
Start learningRelated Videos
Related Practice
Textbook Question
