


Textbook Question
In Exercises 5 and 6, use the scatterplot to find the value of the rank correlation coefficient and the critical values corresponding to a 0.05 significance level used to test the null hypothesis of . Determine whether there is a correlation.
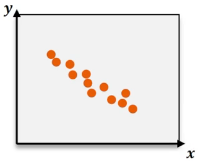
Altitude and Temperature Shown below is a scatterplot of altitudes (thousands of feet) and outside air temperatures (degrees Fahrenheit) recorded by the author during a Delta flight from New Orleans to Atlanta.

