Appendix B Data Sets
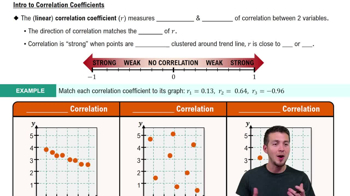
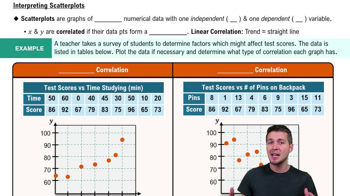
In Exercises 29–32, use the data from Appendix B to construct a scatterplot, find the value of the linear correlation coefficient r, and find either the P-value or the critical values of r from Table A-6 using a significance level of α = 0.05. Determine whether there is sufficient evidence to support the claim of a linear correlation between the two variables.
Taxis Repeat Exercise 15 using all of the time/tip data from the 703 taxi rides listed in Data Set 32 “Taxis” from Appendix B. Compare the results to those found in Exercise 15.


