Here are the essential concepts you must grasp in order to answer the question correctly.
Linear Correlation Coefficient (r)
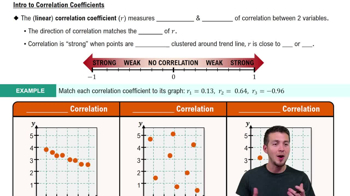
The linear correlation coefficient, denoted as r, measures the strength and direction of a linear relationship between two variables. Its value ranges from -1 to 1, where -1 indicates a perfect negative correlation, 1 indicates a perfect positive correlation, and 0 indicates no correlation. Understanding r is crucial for interpreting how closely two variables are related.
Recommended video:
Slope of a Regression Line (b1)
The slope of a regression line, represented as b1, quantifies the change in the dependent variable for each unit change in the independent variable. A positive slope indicates that as the independent variable increases, the dependent variable also increases, while a negative slope indicates the opposite. The slope is a key component in understanding the nature of the relationship modeled by the regression.
Recommended video:
Relationship Between r and b1
The relationship between the linear correlation coefficient r and the slope b1 is significant in regression analysis. Specifically, when both variables are standardized, the slope b1 is equal to the correlation coefficient r. This means that a strong correlation (high absolute value of r) typically corresponds to a steep slope, indicating a strong linear relationship between the variables.
Recommended video:
Probabilities Between Two Values