National surveys indicate that 36% of people have been in a car accident in the last 5 years. If you randomly sample 10 people, how likely is that exactly 4 have had an accident in the last 5 years?
Table of contents
- 1. Intro to Stats and Collecting Data1h 14m
- 2. Describing Data with Tables and Graphs1h 56m
- 3. Describing Data Numerically2h 5m
- 4. Probability2h 16m
- 5. Binomial Distribution & Discrete Random Variables3h 6m
- 6. Normal Distribution and Continuous Random Variables2h 11m
- 7. Sampling Distributions & Confidence Intervals: Mean3h 23m
- Sampling Distribution of the Sample Mean and Central Limit Theorem19m
- Distribution of Sample Mean - Excel23m
- Introduction to Confidence Intervals15m
- Confidence Intervals for Population Mean1h 18m
- Determining the Minimum Sample Size Required12m
- Finding Probabilities and T Critical Values - Excel28m
- Confidence Intervals for Population Means - Excel25m
- 8. Sampling Distributions & Confidence Intervals: Proportion2h 10m
- 9. Hypothesis Testing for One Sample5h 8m
- Steps in Hypothesis Testing1h 6m
- Performing Hypothesis Tests: Means1h 4m
- Hypothesis Testing: Means - Excel42m
- Performing Hypothesis Tests: Proportions37m
- Hypothesis Testing: Proportions - Excel27m
- Performing Hypothesis Tests: Variance12m
- Critical Values and Rejection Regions28m
- Link Between Confidence Intervals and Hypothesis Testing12m
- Type I & Type II Errors16m
- 10. Hypothesis Testing for Two Samples5h 37m
- Two Proportions1h 13m
- Two Proportions Hypothesis Test - Excel28m
- Two Means - Unknown, Unequal Variance1h 3m
- Two Means - Unknown Variances Hypothesis Test - Excel12m
- Two Means - Unknown, Equal Variance15m
- Two Means - Unknown, Equal Variances Hypothesis Test - Excel9m
- Two Means - Known Variance12m
- Two Means - Sigma Known Hypothesis Test - Excel21m
- Two Means - Matched Pairs (Dependent Samples)42m
- Matched Pairs Hypothesis Test - Excel12m
- Two Variances and F Distribution29m
- Two Variances - Graphing Calculator16m
- 11. Correlation1h 24m
- 12. Regression3h 33m
- Linear Regression & Least Squares Method26m
- Residuals12m
- Coefficient of Determination12m
- Regression Line Equation and Coefficient of Determination - Excel8m
- Finding Residuals and Creating Residual Plots - Excel11m
- Inferences for Slope31m
- Enabling Data Analysis Toolpak1m
- Regression Readout of the Data Analysis Toolpak - Excel21m
- Prediction Intervals13m
- Prediction Intervals - Excel19m
- Multiple Regression - Excel29m
- Quadratic Regression15m
- Quadratic Regression - Excel10m
- 13. Chi-Square Tests & Goodness of Fit2h 21m
- 14. ANOVA2h 28m
5. Binomial Distribution & Discrete Random Variables
Binomial Distribution
Problem 5.1.24
Textbook Question
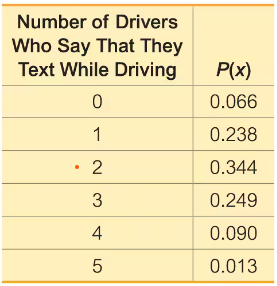
Texting and Driving. In Exercises 21–26, refer to the accompanying table, which describes probabilities for groups of five drivers. The random variable x is the number of drivers in a group who say that they text while driving (based on data from an Arity survey of drivers).

Using Probabilities for Significant Events
a. Find the probability of getting exactly 3 drivers who say that they text while driving.
 Verified step by step guidance
1
Step 1: Understand the problem. The random variable x represents the number of drivers in a group of five who say they text while driving. The table provides the probabilities P(x) for each possible value of x (from 0 to 5). We are tasked with finding the probability of exactly 3 drivers who say they text while driving.
Step 2: Locate the relevant probability in the table. To find the probability of exactly 3 drivers, look for the row where the number of drivers is 3. The corresponding probability P(3) is provided in the table.
Step 3: Interpret the table. From the table, the probability P(3) is listed as 0.249. This value represents the likelihood of having exactly 3 drivers in the group who text while driving.
Step 4: Verify the context. Ensure that the table is based on valid data and that the probabilities sum to 1, as this confirms the table represents a valid probability distribution.
Step 5: Conclude the process. The probability of getting exactly 3 drivers who say they text while driving is directly obtained from the table as P(3). No further calculations are needed since the value is explicitly provided.
 Verified video answer for a similar problem:
This video solution was recommended by our tutors as helpful for the problem above
Video duration:
3mPlay a video:
0 Comments
Key Concepts
Here are the essential concepts you must grasp in order to answer the question correctly.
Random Variable
A random variable is a numerical outcome of a random phenomenon. In this context, the random variable x represents the number of drivers in a group of five who report texting while driving. Understanding random variables is crucial for analyzing probabilities and making inferences about the data collected.
Recommended video:
Guided course

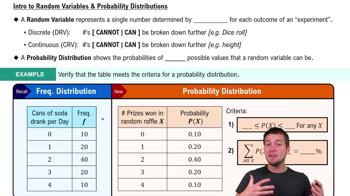
Intro to Random Variables & Probability Distributions
Probability Distribution
A probability distribution describes how probabilities are assigned to each possible value of a random variable. The table provided shows the probability distribution for the random variable x, indicating the likelihood of 0 to 5 drivers texting while driving. This distribution is essential for calculating specific probabilities, such as the probability of exactly 3 drivers texting.
Recommended video:
Guided course

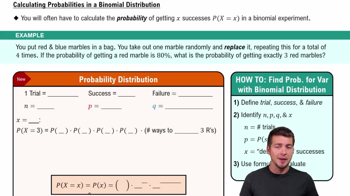
Calculating Probabilities in a Binomial Distribution
Calculating Probabilities
Calculating probabilities involves determining the likelihood of a specific event occurring based on the probability distribution. For this question, to find the probability of exactly 3 drivers texting while driving, one would refer to the table and identify the corresponding P(x) value, which is 0.249. This process is fundamental in statistics for making predictions and decisions based on data.
Recommended video:
Guided course

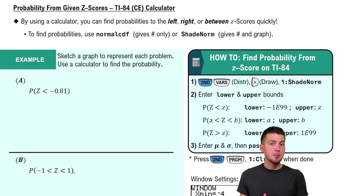
Probability From Given Z-Scores - TI-84 (CE) Calculator

 6:00m
6:00mWatch next
Master The Binomial Experiment with a bite sized video explanation from Patrick
Start learningRelated Videos
Related Practice
Multiple Choice
