Here are the essential concepts you must grasp in order to answer the question correctly.
Poisson Distribution
The Poisson distribution is a probability distribution that expresses the probability of a given number of events occurring in a fixed interval of time or space, given a known average rate of occurrence. It is particularly useful for modeling rare events, such as deaths in a population, where the events occur independently of each other.
Recommended video:
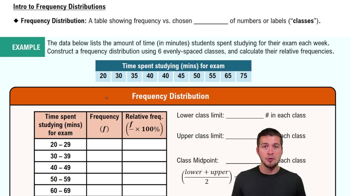
Intro to Frequency Distributions
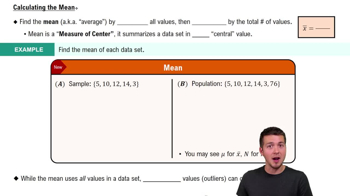
Mean
The mean, often referred to as the average, is a measure of central tendency that is calculated by summing all values in a dataset and dividing by the number of values. In the context of the question, the mean number of deaths per year can be converted to a daily mean by dividing the annual average by the number of days in a year.
Recommended video:
Rate Conversion
Rate conversion involves adjusting a rate from one time frame to another, such as converting annual rates to daily rates. This is done by dividing the annual figure by the number of time units in a year, typically 365 days, to find the average occurrence per day, which is essential for understanding daily trends in data.
Recommended video:
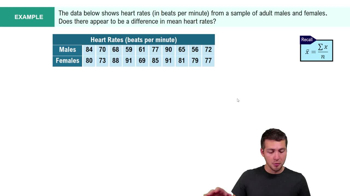
Calculating the Mean Example 1