Back
BackProblem 3.CQQ.1
Mean of Roller Coaster Speeds Listed below are maximum speeds (km/h) of randomly selected roller coasters in the United States. Find the mean.
70 76 97 81 57 151 194 65 117 65 45 105
Problem 3.CRE.1d
Sugar Listed below are measured weights (mg) of sugar in Domino packets labelled as containing 3500 mg (or 3.5 g).
[IMAGE]
d. Given that the weights are from Domino sugar packets selected from a much larger population, are the weights a sample or a population?
Problem 3.CQQ.5
Roller Coaster Speed Outlier Identify any outliers among the data listed for Exercise 1.
Problem 3.CRE.5
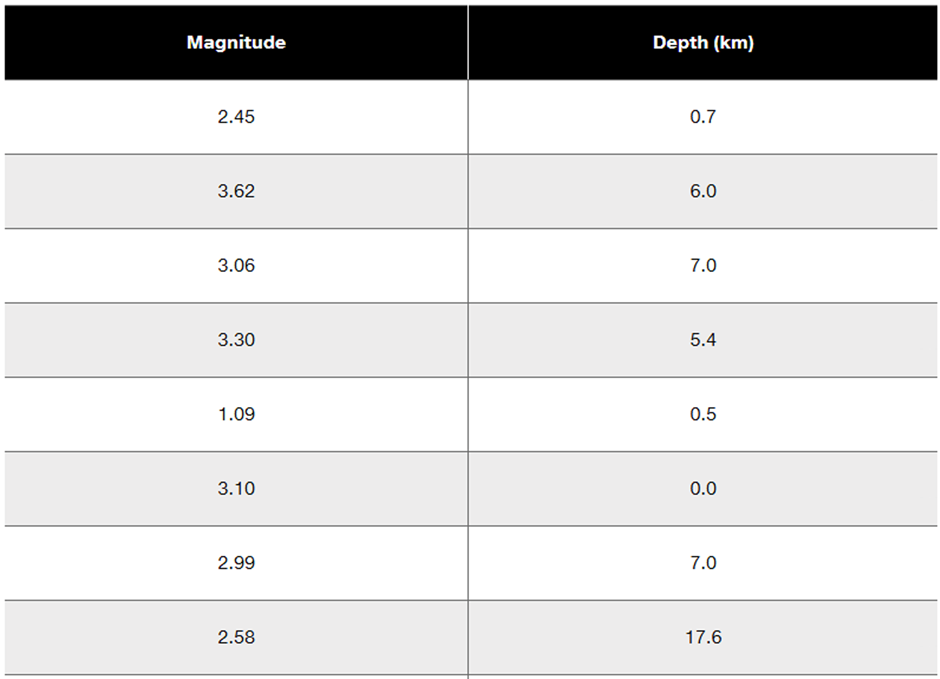
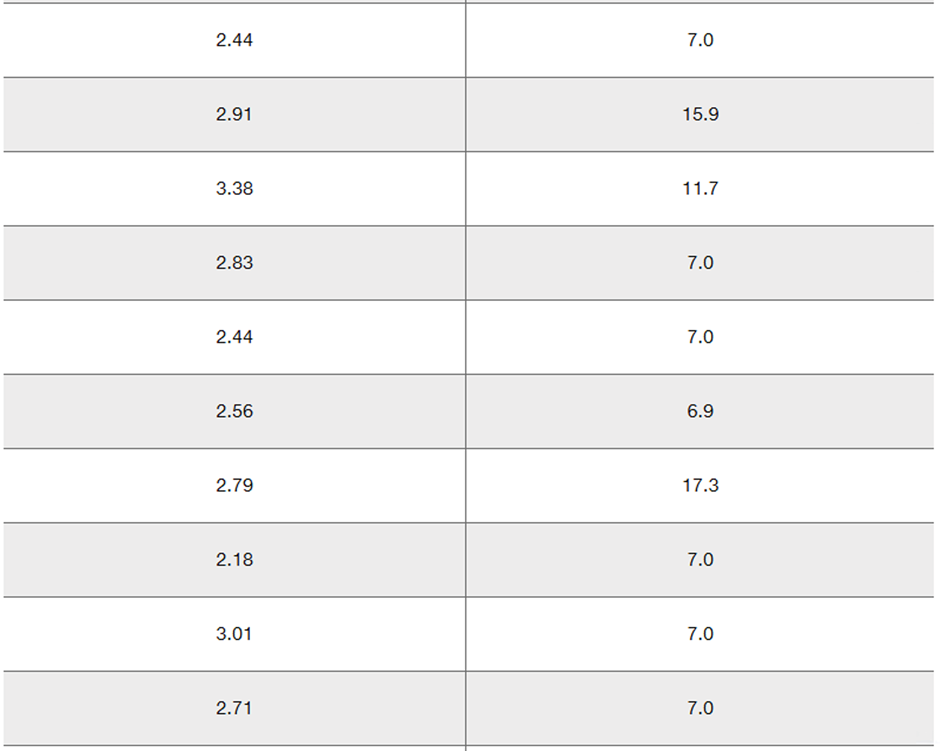
Correlation Between Magnitudes and Depths Using the paired magnitude/depth data, construct the graph that is helpful in determining whether there is a correlation between earthquake magnitudes and depths. Based on the result, does there appear to be a correlation?
Problem 3.RE.4
Boxplot Using the same differences from Exercise 1, construct a boxplot and include the values of the 5-number summary.
Problem 3.q.4
Variance of Roller Coaster Speeds The standard deviation of the sample values in Exercise 1 is 43.1 km/h. What is the variance (including units)?