Back
BackProblem 8.1.14
In Exercises 11 –14, test the claim about the difference between two population means and at the level of significance . Assume the samples are random and independent, and the populations are normally distributed.
Claim: μ1<μ2; α=0.03
Population statistics:σ1=136 and σ2=215
Sample Statistics: x̅1=5004, n1=144, x̅2=4895, n2=156
Problem 8.1.15
Testing the Difference Between Two Means In Exercises 15–24, (a) identify the claim and state Ho and Ha, (b) find the critical value(s) and identify the rejection region(s), (c) find the standardized test statistic z, (d) decide whether to reject or fail to reject the null hypothesis, and (e) interpret the decision in the context of the original claim. Assume the samples are random and independent, and the populations are normally distributed.
Braking Distances To compare the dry braking distances from 60 to 0 miles per hour for two makes of automobiles, a safety engineer conducts braking tests for 16 compact SUVs and 11 midsize SUVs. The mean braking distance for the compact SUVs is 131.8 feet. Assume the population standard deviation is 5.5 feet. The mean braking distance for the midsize SUVs is 132.8 feet. Assume the population standard deviation is 6.7 feet. At α=0.10 , can the engineer support the claim that the mean braking distances are different for the two categories of SUVs? (Adapted from Consumer Reports)
Problem 8.1.17
Test the claim about the difference between two population means and at the level of significance α. Assume the samples are random and independent, and the populations are normally distributed.
Claim: μ1=μ2, α=0.01, Assume (σ1)^2=(σ2)^2
Problem 8.1.19
Testing the Difference Between Two Means In Exercises 15–24, (a) identify the claim and state Ho and Ha, (b) find the critical value(s) and identify the rejection region(s), (c) find the standardized test statistic z, (d) decide whether to reject or fail to reject the null hypothesis, and (e) interpret the decision in the context of the original claim. Assume the samples are random and independent, and the populations are normally distributed.
ACT Mathematics and Science Scores The mean ACT mathematics score for 60 high school students is 20.2. Assume the population standard deviation is 5.7. The mean ACT science score for 75 high school students is 20.6. Assume the population standard deviation is 5.9. At α=0.01, can you reject the claim that ACT mathematics and science scores are equal? (Source: ACT, Inc.)
Problem 8.1.25
Getting at the Concept Explain why the null hypothesis Ho: μ1=μ2 is equivalent to the null hypothesis .Ho: μ1-μ2=0
Problem 8.1.20
Testing the Difference Between Two Means In Exercises 15–24, (a) identify the claim and state Ho and Ha, (b) find the critical value(s) and identify the rejection region(s), (c) find the standardized test statistic z, (d) decide whether to reject or fail to reject the null hypothesis, and (e) interpret the decision in the context of the original claim. Assume the samples are random and independent, and the populations are normally distributed.
ACT English and Reading Scores The mean ACT English score for 120 high school students is 19.9. Assume the population standard deviation is 7.2. The mean ACT reading score for 150 high school students is 21.2. Assume the population standard deviation is 7.1. At α=0.10, can you support the claim that ACT reading scores are higher than ACT English scores? (Source: ACT, Inc.)
Problem 8.1.27
Testing a Difference Other Than Zero Sometimes a researcher is interested in testing a difference in means other than zero. In Exercises 27 and 28, you will test the difference between two means using a null hypothesis of Ho: μ1-μ2=k, Ho: μ1-μ2>=k or Ho: μ1-μ2<=k . The standardized test statistic is still
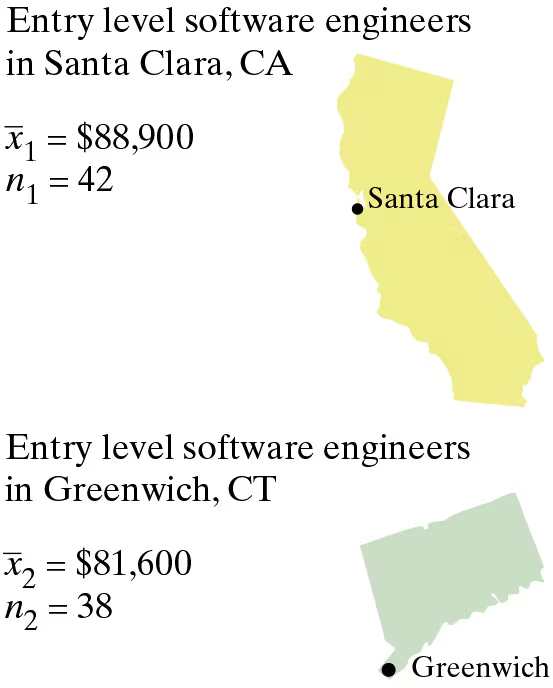
Software Engineer Salaries Is the difference between the mean annual salaries of entry level software engineers in Santa Clara, California, and Greenwich, Connecticut, more than $4000? To decide, you select a random sample of entry level software engineers from each city. The results of each survey are shown in the figure at the left. Assume the population standard deviations are σ1=$14,060 and σ2=$13,050 . At α=0.05, what should you conclude? (Adapted from Salary.com)
Problem 8.1.29
Constructing Confidence Intervals for μ1-μ2. You can construct a confidence interval for the difference between two population means μ1-μ2 , as shown below, when both population standard deviations are known, and either both populations are normally distributed or both n1>= 30 and n2>=30 . Also, the samples must be randomly selected and independent.
[Image]
In Exercises 29 and 30, construct the indicated confidence interval for μ1-μ2 .
Software Engineer Salaries Construct a 95% confidence interval for the difference between the mean annual salaries of entry level software engineers in Santa Clara, California, and Greenwich, CT, using the data from Exercise 27.
Problem 8.1.6
Independent and Dependent Samples In Exercises 5– 8, classify the two samples as independent or dependent and justify your answer.
Sample 1: The IQ scores of 60 females
Sample 2: The IQ scores of 60 males
Problem 8.10
In Exercises 7–10, the statement represents a claim. Write its complement and state which is Ho and which is Ha.
μ≠2.28
Problem 8.12b
The mean room rate for two adults for a random sample of 26 three-star hotels in Cincinnati has a sample standard deviation of $31. Assume the population is normally distributed. (Adapted from Expedia)
Construct a 99% confidence interval for the population standard deviation.
Problem 8.2.13
Testing the Difference Between Two Means, (a) identify the claim and state H0 and Ha , (b) find the critical value(s) and identify the rejection region(s), (c) find the standardized test statistic t, (d) decide whether to reject or fail to reject the null hypothesis, and (e) interpret the decision in the context of the original claim. Assume the samples are random and independent, and the populations are normally distributed.
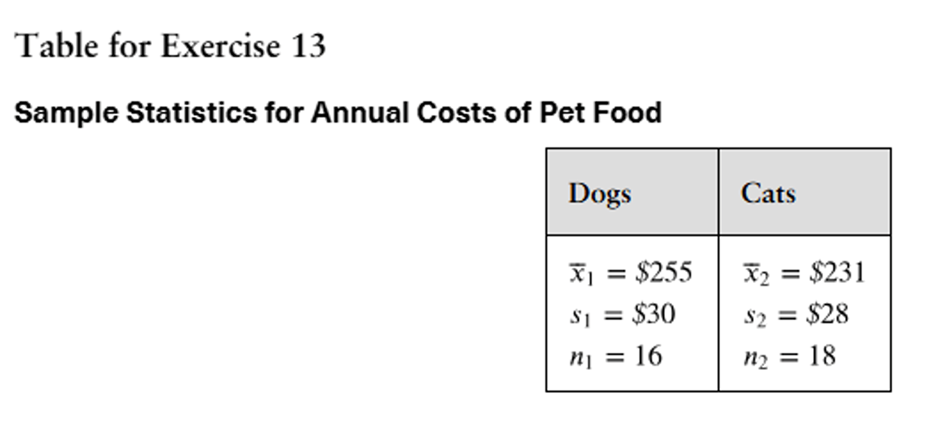
Pet Food
A pet association claims that the mean annual costs of food for dogs and cats are the same. The results for samples of the two types of pets are shown at the left. At , α=0.10 can you reject the pet association’s claim? Assume the population variances are equal. (Adapted from American Pet Products Association)
Problem 8.2.1
What conditions are necessary to use the t-test for testing the difference between two population means?
Problem 8.2.2
Explain how to perform a two-sample t-test for the difference between two population means.
Problem 8.2.4
Find the critical value(s) for the alternative hypothesis, level of significance , and sample sizes and . Assume that the samples are random and independent, the populations are normally distributed, and the population variances are (a) equal and (b) not equal.
Ha:μ1>μ2 , α=0.01 , n1=12 , n2=15
Problem 8.2.21
[APPLET] Teaching Methods
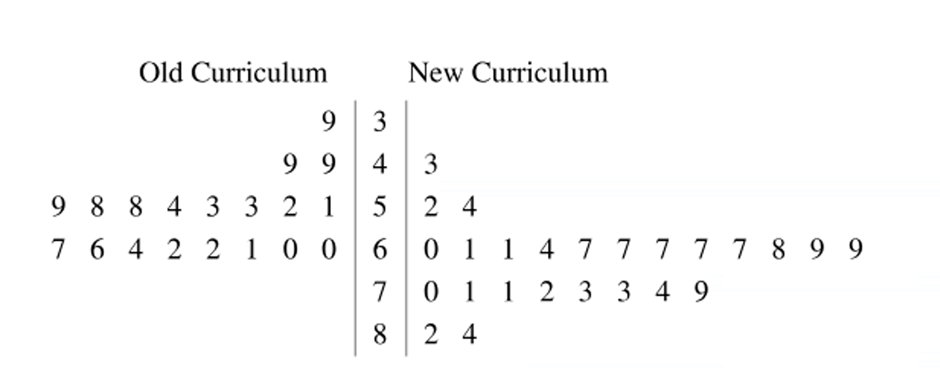
A new method of teaching reading is being tested on third grade students. A group of third grade students is taught using the new curriculum. A control group of third grade students is taught using the old curriculum. The reading test scores for the two groups are shown in the back-to-back stem-and-leaf plot.
At , α=0.10 is there enough evidence to support the claim that the new method of teaching reading produces higher reading test scores than the old method does? Assume the population variances are equal.
Problem 8.2.22
[APPLET] Teaching Methods
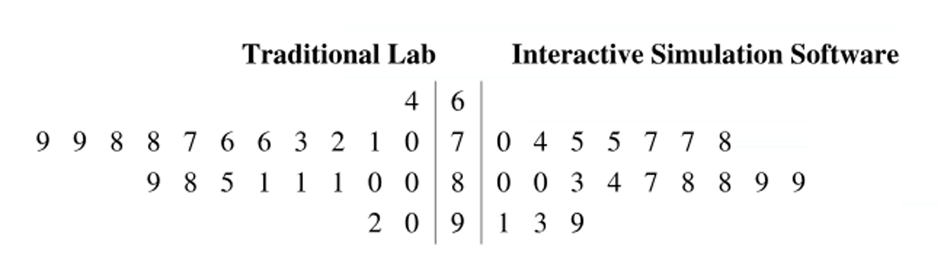
Two teaching methods and their effects on science test scores are being reviewed. A group of students is taught in traditional lab sessions. A second group of students is taught using interactive simulation software. The science test scores for the two groups are shown in the back-to-back stem-and-leaf plot.
At , α=0.01 can you support the claim that the mean science test score is lower for students taught using the traditional lab method than it is for students taught using the interactive simulation software? Assume the population variances are equal.
Problem 8.2.23
Constructing Confidence Intervals for μ1-μ2, When the sampling distribution for x̅1-x̅2 is approximated by a t-distribution and the population variances are not equal, you can construct a confidence interval for μ1-μ2 , as shown below.
construct the indicated confidence interval for μ1-μ2 . Assume the populations are approximately normal with unequal variances.
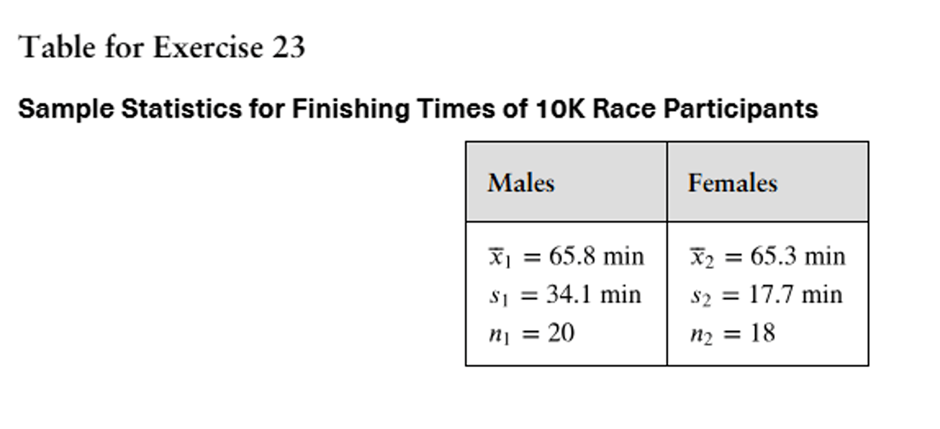
10K Race
To compare the mean finishing times of male and female participants in a 10K race, you randomly select several finishing times from both sexes. The results are shown at the left. Construct an 80% confidence interval for the difference in mean finishing times of male and female participants in the race. (Adapted from Great Race)
Problem 8.2.15
Blue Crabs A marine researcher claims that the stomachs of blue crabs from one location contain more fish than the stomachs of blue crabs from another location. The stomach contents of a sample of 25 blue crabs from Location A contain a mean of 320 milligrams of fish and a standard deviation of 60 milligrams. The stomach contents of a sample of 15 blue crabs from Location B contain a mean of 280 milligrams of fish and a standard deviation of 80 milligrams. At , α= 0.01can you support the marine researcher’s claim? Assume the population variances are equal.
Problem 8.2.17
Annual Income
A politician claims that the mean household income in a recent year is greater in York County, South Carolina, than it is in Elmore County, Alabama. In York County, a sample of 23 residents has a mean household income of $64,900 and a standard deviation of $16,000. In Elmore County, a sample of 19 residents has a mean household income of $59,500 and a standard deviation of $23,600. At , α= 0.05can you support the politician’s claim? Assume the population variances are not equal. (Adapted from U.S. Census Bureau)
Problem 8.2.19
[APPLET] Tensile Strength
The tensile strength of a metal is a measure of its ability to resist tearing when it is pulled lengthwise. An experimental method of treatment produced steel bars with the tensile strengths (in newtons per square millimeter) listed below.
Experimental Method:
391 383 333 378 368 401 339 376 366 348
The conventional method produced steel bars with the tensile strengths (in newtons per square millimeter) listed below.
Conventional Method:
362 382 368 398 381 391 400410 396 411 385 385 395 371
At , α=0.01 can you support the claim that the experimental method of treatment makes a difference in the tensile strength of steel bars? Assume the population variances are equal.
Problem 8.2.11
Test the claim about the difference between two population means and at the level of significance α. Assume the samples are random and independent, and the populations are normally distributed.
Claim: μ1≤μ2, α=0.05, Assume (σ1)^2≠(σ2)^2
Sample statistics:
x̅1=2410, s1=175, n1=13 and x̅2=2305, s2=52, n2=10
Problem 8.2.9
Test the claim about the difference between two population means and at the level of significance α. Assume the samples are random and independent, and the populations are normally distributed.
Claim: μ1=μ2, α=0.01, Assume (σ1)^2=(σ2)^2
Sample statistics:
x̅1=33.7, s1=3.5 , n1=12 and x̅2=35.5 , s2=2.2 , n2=17
Problem 8.3.3
Test the claim about the mean of the differences for a population of paired data at the level of significance α. Assume the samples are random and dependent, and the populations are normally distributed.
Claim: μd<0 , α=0.05 , Sample statistics: d̄ =1.5 , sd=3.2 , n=14
Problem 8.3.1
What conditions are necessary to use the dependent samples t-test for the mean of the differences for a population of paired data?
Problem 8.3.5
Test the claim about the mean of the differences for a population of paired data at the level of significance α. Assume the samples are random and dependent, and the populations are normally distributed.
Claim: μd≤0 , α=0.10, Sample statistics: d̄ =6.5, sd=9.54, n=16
Problem 8.3.23
Constructing Confidence Intervals for μd To construct a confidence interval for μd , use the inequality below.
Construct the indicated confidence interval for μd . Assume the populations are normally distributed.
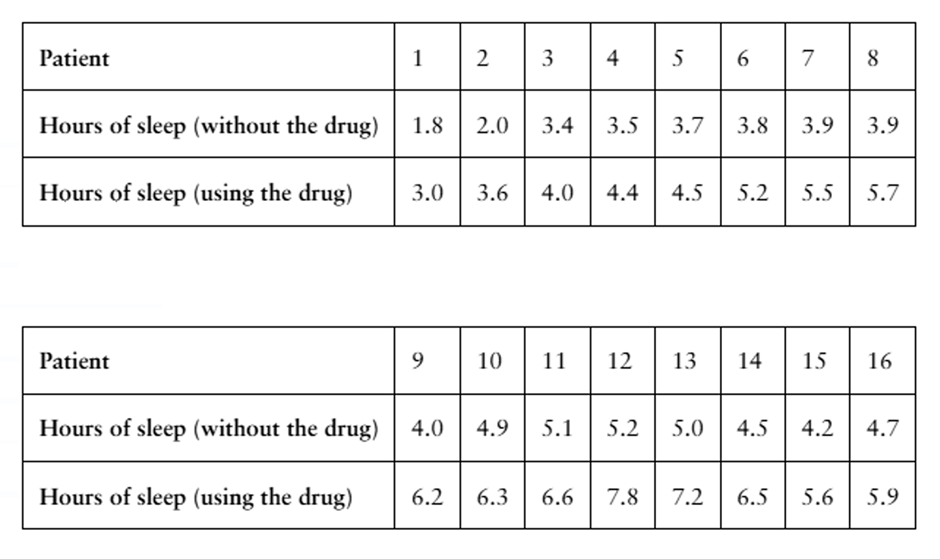
[APPLET] Drug Testing A sleep disorder specialist wants to test the effectiveness of a new drug that is reported to increase the number of hours of sleep patients get during the night. To do so, the specialist randomly selects 16 patients and records the number of hours of sleep each gets with and without the new drug. The table shows the results of the two-night study. Construct a 90% confidence interval for μd.
Problem 8.3.14
Testing the Difference Between Two Means (a) identify the claim and state Ho and Ha , (b) find the critical value(s) and identify the rejection region(s), (c) calculate d̄ and Sd, (d) find the standardized test statistic t, (e) decide whether to reject or fail to reject the null hypothesis, and (f ) interpret the decision in the context of the original claim. Assume the samples are random and dependent, and the populations are normally distributed.
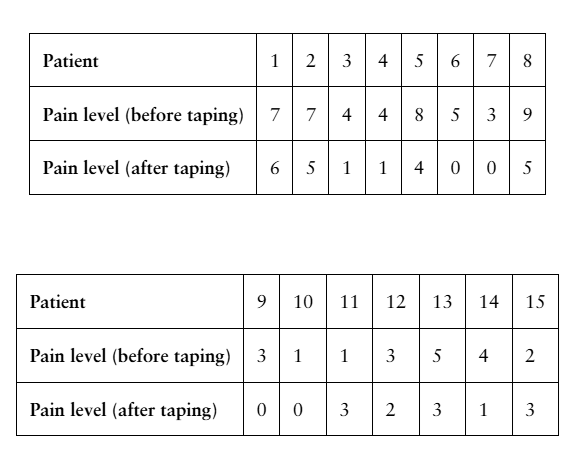
[APPLET] Therapeutic Taping
A physical therapist claims that the use of a specific type of therapeutic tape reduces pain in patients with chronic tennis elbow. The table shows the pain levels on a scale of 0 to 10, where 0 is no pain and 10 is the worst pain possible, for 15 patients with chronic tennis elbow when holding a 1 kilogram weight. At , α=0.05 is there enough evidence to support the therapist’s claim? (Adapted from BioMed Central, Ltd.)
Problem 8.3.9a
Testing the Difference Between Two Means (a) identify the claim and state Ho and Ha
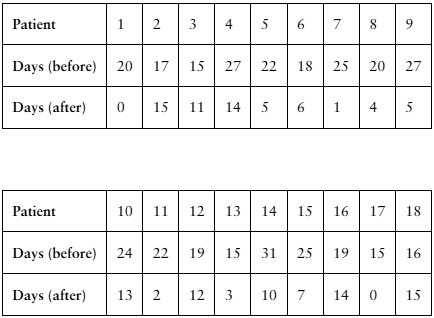
[APPLET] Migraines
A researcher claims that injections of onabotulinumtoxinA reduce the number of days per month that chronic migraine sufferers have headaches. The table shows the number of days chronic migraine sufferers suffered migraines before and after using the treatment. At , α= 0.01 is there enough evidence to support the researcher’s claim? (Adapted from Journal of Headache and Pain)
Problem 8.3.9b
Testing the Difference Between Two Means, (b) find the critical value(s) and identify the rejection region(s), Assume the samples are random and dependent, and the populations are normally distributed.
[APPLET] Migraines
A researcher claims that injections of onabotulinumtoxinA reduce the number of days per month that chronic migraine sufferers have headaches. The table shows the number of days chronic migraine sufferers suffered migraines before and after using the treatment. At , α= 0.01 is there enough evidence to support the researcher’s claim? (Adapted from Journal of Headache and Pain)