Back
BackProblem 10.Q.4e
In each exercise,
e. interpret the decision in the context of the original claim.
[APPLET] In Exercises 3 and 4, use the data, which list the annual wages (in thousands of dollars) for randomly selected individuals from three metropolitan areas. Assume the wages are normally distributed and that the samples are independent. (Adapted from U.S. Bureau of Economic Analysis)
Ithaca, NY: 53.0, 60.3, 34.6, 37.1, 46.6, 46.8, 41.4, 50.6, 50.8, 49.4, 35.0, 36.7, 57.1
Little Rock, AR: 50.7, 43.7, 53.4, 40.0, 45.2, 52.7, 35.2, 60.4, 40.0, 45.9, 45.7, 47.3, 46.5, 44.5, 31.5
Madison, WI: 62.4, 53.9, 67.6, 52.9, 67.7, 50.7, 62.1, 58.9, 61.1, 65.0, 60.4, 59.6, 51.3, 44.8, 66.2
Are the mean annual wages the same for all three cities? Use α=0.10. Assume that the population variances are equal.
Problem 10.Q.2c
In each exercise,
c. find the test statistic,
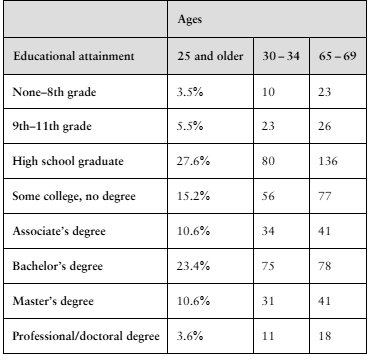
In Exercises 1 and 2, use the table, which lists the distribution of educational achievement for people in the United States ages 25 and older. It also lists the results of a random survey for two additional age groups. (Adapted from U.S. Census Bureau)
Use the data for 30- to 34-year-olds and 65- to 69-year-olds to test whether age and educational attainment are related. Use α=0.01.
Problem 10.Q.4d
In each exercise,
d. decide whether to reject or fail to reject the null hypothesis, and
[APPLET] In Exercises 3 and 4, use the data, which list the annual wages (in thousands of dollars) for randomly selected individuals from three metropolitan areas. Assume the wages are normally distributed and that the samples are independent. (Adapted from U.S. Bureau of Economic Analysis)
Ithaca, NY: 53.0, 60.3, 34.6, 37.1, 46.6, 46.8, 41.4, 50.6, 50.8, 49.4, 35.0, 36.7, 57.1
Little Rock, AR: 50.7, 43.7, 53.4, 40.0, 45.2, 52.7, 35.2, 60.4, 40.0, 45.9, 45.7, 47.3, 46.5, 44.5, 31.5
Madison, WI: 62.4, 53.9, 67.6, 52.9, 67.7, 50.7, 62.1, 58.9, 61.1, 65.0, 60.4, 59.6, 51.3, 44.8, 66.2
Are the mean annual wages the same for all three cities? Use α=0.10. Assume that the population variances are equal.
Problem 10.Q.2a
In each exercise,
a. identify the claim and state H₀ and Hₐ,
In Exercises 1 and 2, use the table, which lists the distribution of educational achievement for people in the United States ages 25 and older. It also lists the results of a random survey for two additional age groups. (Adapted from U.S. Census Bureau)
Use the data for 30- to 34-year-olds and 65- to 69-year-olds to test whether age and educational attainment are related. Use α=0.01.
Problem 10.R.9
"In Exercises 9 –12, find the critical F-value for a right-tailed test using the level of significance α and degrees of freedom d.f.N and d.f.D.
α=0.05,d.f.N=6,d.f.D=50"
Problem 10.R.14
"In Exercises 13 –16, find the critical F-value for a two-tailed test using the level of significance α and degrees of freedom d.f.N and d.f.D.
α=0.05,d.f.N=9,d.f.D=8"
Problem 10.R.21d
In Exercises 21 and 22, (d) decide whether to reject or fail to reject the null hypothesis,
Assume the samples are random and independent, the populations are normally distributed, and the population variances are equal.
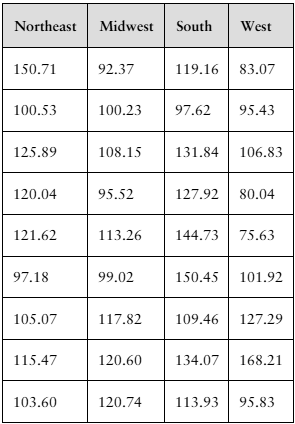
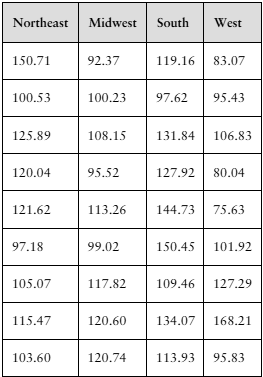
[APPLET] The table shows the monthly electric bills (in dollars) for a sample of households from four regions of the United States. At α=0.10, can you conclude that the mean monthly electric bill is different in at least one of the regions? (Adapted from U.S. Energy Information Administration)
Problem 10.R.22
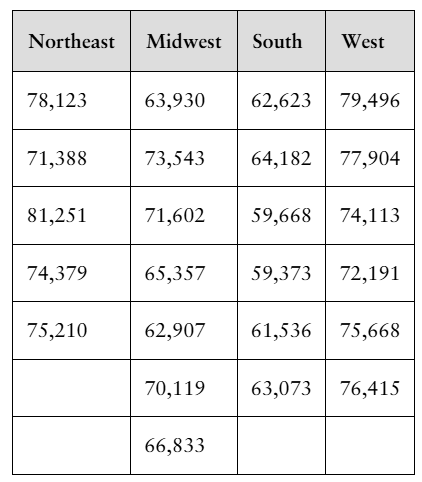
In Exercises 21 and 22, (a) identify the claim and state H₀ and Hₐ, (b) find the critical value and identify the rejection region, (c) find the test statistic F, (d) decide whether to reject or fail to reject the null hypothesis, and (e) interpret the decision in the context of the original claim. Assume the samples are random and independent, the populations are normally distributed, and the population variances are equal.
[APPLET] The table shows the annual incomes (in dollars) for a sample of families from four regions of the United States. At α=0.05, can you conclude that the mean annual income of families is different in at least one of the regions? (Adapted from U.S. Census Bureau)
Problem 10.R.13
"In Exercises 13 –16, find the critical F-value for a two-tailed test using the level of significance α and degrees of freedom d.f.N and d.f.D.
α=0.10,d.f.N=15,d.f.D=27"
Problem 10.R.11
"In Exercises 9 –12, find the critical F-value for a right-tailed test using the level of significance α and degrees of freedom d.f.N and d.f.D.
α=0.10,d.f.N=5,d.f.D=12"
Problem 10.R.21e
In Exercises 21 and 22, (e) interpret the decision in the context of the original claim. Assume the samples are random and independent, the populations are normally distributed, and the population variances are equal.
[APPLET] The table shows the monthly electric bills (in dollars) for a sample of households from four regions of the United States. At α=0.10, can you conclude that the mean monthly electric bill is different in at least one of the regions? (Adapted from U.S. Energy Information Administration)
Problem 10.R.19
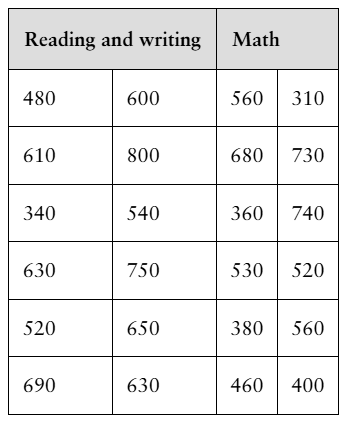
In Exercises 17–20, (a) identify the claim and state H₀ and Hₐ, (b) find the critical value and identify the rejection region, (c) find the test statistic F, (d) decide whether to reject or fail to reject the null hypothesis, and (e) interpret the decision in the context of the original claim. Assume the samples are random and independent, and the populations are normally distributed.
[APPLET] An instructor claims that the variance of SAT evidence-based reading and writing scores is different than the variance of SAT math scores. The table shows the SAT evidence-based reading and writing scores for 12 randomly selected students and the SAT math scores for 12 randomly selected students. At α=0.01, can you support the instructor’s claim?
Problem 10.R.21c
In Exercises 21 and 22, (c) find the test statistic F, Assume the samples are random and independent, the populations are normally distributed, and the population variances are equal.
[APPLET] The table shows the monthly electric bills (in dollars) for a sample of households from four regions of the United States. At α=0.10, can you conclude that the mean monthly electric bill is different in at least one of the regions? (Adapted from U.S. Energy Information Administration)
Problem 10.R.17
"In Exercises 17–20, (a) identify the claim and state H₀ and Hₐ, (b) find the critical value and identify the rejection region, (c) find the test statistic F, (d) decide whether to reject or fail to reject the null hypothesis, and (e) interpret the decision in the context of the original claim. Assume the samples are random and independent, and the populations are normally distributed.
A travel consultant claims that the standard deviations of hotel room rates for Sacramento, CA, and San Francisco, CA, are the same. A sample of 36 hotel room rates in Sacramento has a standard deviation of $51 and a sample of 31 hotel room rates in San Francisco has a standard deviation of $37. At α=0.10, can you reject the travel consultant’s claim? (Adapted from Expedia)"
Problem 10.R.10
"In Exercises 9 –12, find the critical F-value for a right-tailed test using the level of significance α and degrees of freedom d.f.N and d.f.D.
α=0.01,d.f.N=12,d.f.D=10"
Problem 10.RE.8
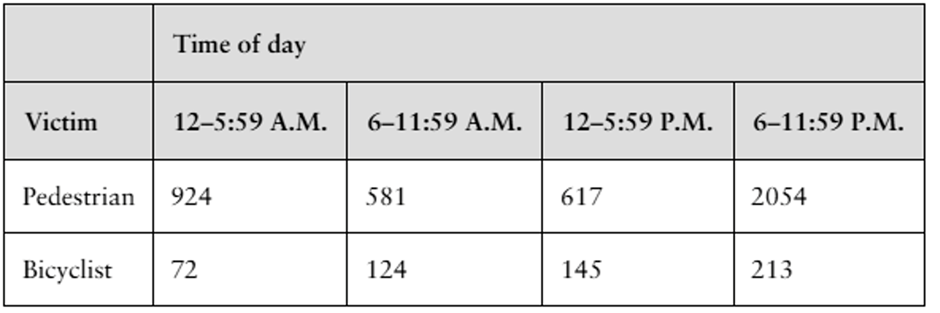
In Exercises 5 – 8, (a) find the expected frequency for each cell in the contingency table, (b) identify the claim and state H0 and Ha, (c) determine the degrees of freedom, find the critical value, and identify the rejection region, (d) find the chi-square test statistic, (e) decide whether to reject or fail to reject the null hypothesis, and (f ) interpret the decision in the context of the original claim.
The contingency table shows the distribution of a random sample of fatal pedestrian and bicyclist motor vehicle collisions by time of day in a recent year. At α=0.10, can you conclude that the type of crash victim and the time of day are related? (Adapted from National Highway Traffic Safety Administration)
Problem 10.RE.16
In Exercises 13 –16, find the critical F-value for a two-tailed test using the level of significance α and degrees of freedom d.f.N and d.f.D.
α=0.01,d.f.N=11,d.f.D=13
Problem 10.RE.3
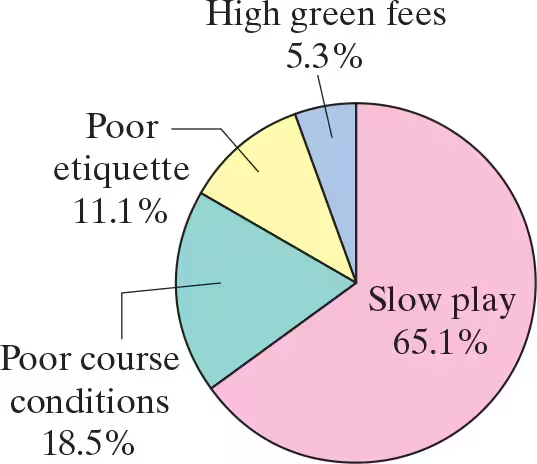
In Exercises 1– 4, (a) identify the claim and state H₀ and Hₐ, (b) find the critical value and identify the rejection region, (c) find the chi-square test statistic, (d) decide whether to reject or fail to reject the null hypothesis, and (e) interpret the decision in the context of the original claim.
A sports website claims that the opinions of golfers about what irritates them the most on the golf course are distributed as shown in the pie chart. You randomly select 1018 golfers and ask them what irritates them the most on the golf course. The table shows the results. At α=0.05, test the sports website’s claim. (Adapted from GOLF.com)
Problem 10.RE.15
In Exercises 13 –16, find the critical F-value for a two-tailed test using the level of significance α and degrees of freedom d.f.N and d.f.D.
α=0.01,d.f.N=40,d.f.D=60
Problem 10.RE.12
In Exercises 9 –12, find the critical F-value for a right-tailed test using the level of significance α and degrees of freedom d.f.N and d.f.D.
α=0.05,d.f.N=20,d.f.D=25
Problem 10.T.3d
In each exercise,
d. decide whether to reject or fail to reject the null hypothesis, and
[APPLET] In Exercises 1–3, use the data, which list the hourly wages (in dollars) for randomly selected surgical technologists from three states. Assume the wages are normally distributed and that the samples are independent. (Adapted from U.S. Bureau of Labor Statistics)
Maine: 22.76, 27.60, 25.08, 17.01, 30.15, 27.09, 20.95, 25.52, 20.11, 23.67, 24.32
Oklahoma: 24.64, 21.66, 19.38, 18.19, 23.14, 20.58, 19.53, 30.77, 27.46, 23.80
Massachusetts: 27.07, 24.71, 32.80, 28.34, 33.45, 33.36, 36.81, 30.04, 29.01, 24.30, 29.22, 29.50
Are the mean hourly wages of surgical technologists the same for all three states? Use α=0.01. Assume that the population variances are equal.
Problem 10.T.3e
In each exercise,
e. interpret the decision in the context of the original claim.
[APPLET] In Exercises 1–3, use the data, which list the hourly wages (in dollars) for randomly selected surgical technologists from three states. Assume the wages are normally distributed and that the samples are independent. (Adapted from U.S. Bureau of Labor Statistics)
Maine: 22.76, 27.60, 25.08, 17.01, 30.15, 27.09, 20.95, 25.52, 20.11, 23.67, 24.32
Oklahoma: 24.64, 21.66, 19.38, 18.19, 23.14, 20.58, 19.53, 30.77, 27.46, 23.80
Massachusetts: 27.07, 24.71, 32.80, 28.34, 33.45, 33.36, 36.81, 30.04, 29.01, 24.30, 29.22, 29.50
Are the mean hourly wages of surgical technologists the same for all three states? Use α=0.01. Assume that the population variances are equal.
Problem 10.1.10a
Performing a Chi-Square Goodness-of-Fit Test
In Exercises 7–16, (a) identify the claim and state H₀ and Hₐ.
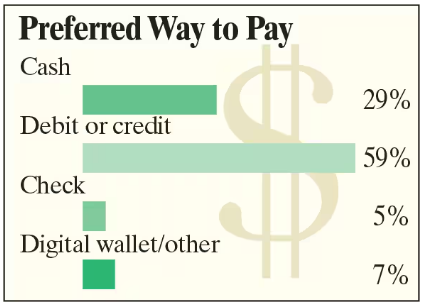
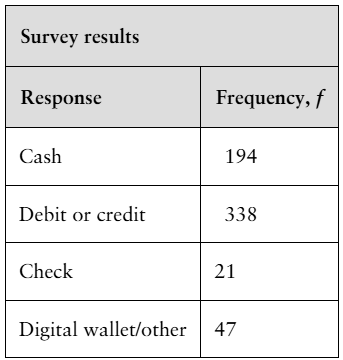
Ways to Pay A financial analyst claims that the distribution of people’s preferences on how to pay for goods is different from the distribution shown in the figure. You randomly select 600 people and record their preferences on how to pay for goods. The table shows the results. At α=0.01, test the financial analyst’s claim. (Adapted from Travis Credit Union)
Problem 10.1.10b
Performing a Chi-Square Goodness-of-Fit Test
In Exercises 7–16, (b) find the critical value and identify the rejection region.
Ways to Pay A financial analyst claims that the distribution of people’s preferences on how to pay for goods is different from the distribution shown in the figure. You randomly select 600 people and record their preferences on how to pay for goods. The table shows the results. At α=0.01, test the financial analyst’s claim. (Adapted from Travis Credit Union)
Problem 10.1.10c
Performing a Chi-Square Goodness-of-Fit Test
In Exercises 7–16, (c) find the chi-square test statistic.
Ways to Pay A financial analyst claims that the distribution of people’s preferences on how to pay for goods is different from the distribution shown in the figure. You randomly select 600 people and record their preferences on how to pay for goods. The table shows the results. At α=0.01, test the financial analyst’s claim. (Adapted from Travis Credit Union)
Problem 10.1.10d
Performing a Chi-Square Goodness-of-Fit Test
In Exercises 7–16, (d) decide whether to reject or fail to reject the null hypothesis.
Ways to Pay A financial analyst claims that the distribution of people’s preferences on how to pay for goods is different from the distribution shown in the figure. You randomly select 600 people and record their preferences on how to pay for goods. The table shows the results. At α=0.01, test the financial analyst’s claim. (Adapted from Travis Credit Union)
Problem 11.1.6
List the two conditions that must be met in order to use the paired-sample sign test.