Interpreting Power Chantix (varenicline) tablets are used as an aid to help people stop smoking. In a clinical trial, 129 subjects were treated with Chantix twice a day for 12 weeks, and 16 subjects experienced abdominal pain (based on data from Pfizer, Inc.). If someone claims that more than 8% of Chantix users experience abdominal pain, that claim is supported with a hypothesis test conducted with a 0.05 significance level. Using 0.18 as an alternative value of p, the power of the test is 0.96. Interpret this value of the power of the test.
Table of contents
- 1. Intro to Stats and Collecting Data1h 14m
- 2. Describing Data with Tables and Graphs1h 56m
- 3. Describing Data Numerically2h 5m
- 4. Probability2h 16m
- 5. Binomial Distribution & Discrete Random Variables3h 6m
- 6. Normal Distribution and Continuous Random Variables2h 11m
- 7. Sampling Distributions & Confidence Intervals: Mean3h 23m
- Sampling Distribution of the Sample Mean and Central Limit Theorem19m
- Distribution of Sample Mean - Excel23m
- Introduction to Confidence Intervals15m
- Confidence Intervals for Population Mean1h 18m
- Determining the Minimum Sample Size Required12m
- Finding Probabilities and T Critical Values - Excel28m
- Confidence Intervals for Population Means - Excel25m
- 8. Sampling Distributions & Confidence Intervals: Proportion2h 10m
- 9. Hypothesis Testing for One Sample5h 8m
- Steps in Hypothesis Testing1h 6m
- Performing Hypothesis Tests: Means1h 4m
- Hypothesis Testing: Means - Excel42m
- Performing Hypothesis Tests: Proportions37m
- Hypothesis Testing: Proportions - Excel27m
- Performing Hypothesis Tests: Variance12m
- Critical Values and Rejection Regions28m
- Link Between Confidence Intervals and Hypothesis Testing12m
- Type I & Type II Errors16m
- 10. Hypothesis Testing for Two Samples5h 37m
- Two Proportions1h 13m
- Two Proportions Hypothesis Test - Excel28m
- Two Means - Unknown, Unequal Variance1h 3m
- Two Means - Unknown Variances Hypothesis Test - Excel12m
- Two Means - Unknown, Equal Variance15m
- Two Means - Unknown, Equal Variances Hypothesis Test - Excel9m
- Two Means - Known Variance12m
- Two Means - Sigma Known Hypothesis Test - Excel21m
- Two Means - Matched Pairs (Dependent Samples)42m
- Matched Pairs Hypothesis Test - Excel12m
- Two Variances and F Distribution29m
- Two Variances - Graphing Calculator16m
- 11. Correlation1h 24m
- 12. Regression3h 33m
- Linear Regression & Least Squares Method26m
- Residuals12m
- Coefficient of Determination12m
- Regression Line Equation and Coefficient of Determination - Excel8m
- Finding Residuals and Creating Residual Plots - Excel11m
- Inferences for Slope31m
- Enabling Data Analysis Toolpak1m
- Regression Readout of the Data Analysis Toolpak - Excel21m
- Prediction Intervals13m
- Prediction Intervals - Excel19m
- Multiple Regression - Excel29m
- Quadratic Regression15m
- Quadratic Regression - Excel10m
- 13. Chi-Square Tests & Goodness of Fit2h 21m
- 14. ANOVA2h 28m
9. Hypothesis Testing for One Sample
Steps in Hypothesis Testing
Problem 8.2.1b
Textbook Question
Statistical Literacy and Critical Thinking
In Exercises 1–4, use the results from a Hankook Tire Gauge Index survey of a simple random sample of 1020 adults. Among the 1020 respondents, 86% rated themselves as above average drivers. We want to test the claim that more than 3/4 of adults rate themselves as above average drivers.
Number and Proportions
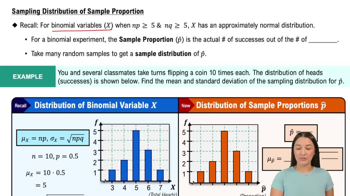
b. Identify the sample proportion and use the symbol that represents it.
 Verified step by step guidance
1
Step 1: Understand the problem. The goal is to identify the sample proportion from the given data and use the appropriate statistical symbol to represent it. The sample proportion is the ratio of respondents who rated themselves as above average drivers to the total number of respondents.
Step 2: Recall the formula for sample proportion. The sample proportion (denoted as ) is calculated as: , where is the number of respondents who rated themselves as above average drivers, and is the total sample size.
Step 3: Extract the values from the problem. The total sample size is , and the percentage of respondents who rated themselves as above average drivers is . Convert this percentage to a proportion by dividing by 100: .
Step 4: Calculate the number of respondents who rated themselves as above average drivers. Multiply the proportion () by the total sample size (): .
Step 5: Substitute the values into the formula for sample proportion. Use to represent the sample proportion, where is the number of respondents calculated in Step 4 and is .
 Verified video answer for a similar problem:
This video solution was recommended by our tutors as helpful for the problem above
Video duration:
1mPlay a video:
0 Comments
Key Concepts
Here are the essential concepts you must grasp in order to answer the question correctly.
Sample Proportion
The sample proportion is a statistic that represents the fraction of a sample that possesses a certain characteristic. It is calculated by dividing the number of individuals in the sample with the characteristic by the total number of individuals in the sample. In this case, the sample proportion of adults who rate themselves as above average drivers can be expressed as 0.86, or 86%, based on the survey results.
Recommended video:

Sampling Distribution of Sample Proportion
Hypothesis Testing
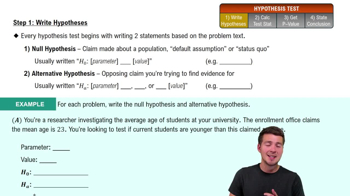
Hypothesis testing is a statistical method used to make inferences about a population based on sample data. It involves formulating a null hypothesis (the default assumption) and an alternative hypothesis (the claim being tested). In this scenario, the null hypothesis would state that 75% or fewer adults rate themselves as above average drivers, while the alternative hypothesis would assert that more than 75% do.
Recommended video:
Guided course

Step 1: Write Hypotheses
Simple Random Sample
A simple random sample is a subset of individuals chosen from a larger population in such a way that every individual has an equal chance of being selected. This method helps ensure that the sample is representative of the population, reducing bias in the results. In the context of the survey, the 1020 adults surveyed were selected randomly, which supports the validity of the conclusions drawn from the sample.
Recommended video:

Sampling Distribution of Sample Proportion

 6:21m
6:21mWatch next
Master Step 1: Write Hypotheses with a bite sized video explanation from Patrick
Start learningRelated Videos
Related Practice
Textbook Question
