Stemplot
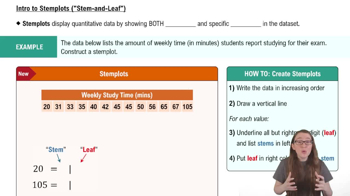
A stemplot, or stem-and-leaf plot, is a graphical representation of quantitative data that organizes values into 'stems' and 'leaves.' The stem represents the leading digit(s) of the data values, while the leaves represent the trailing digits. For example, in the row '3 | 000144669', the stem '3' indicates that all values are in the 30s, and the leaves '000144669' represent the specific values 30, 30, 30, 31, 34, 36, 36, and 39.
Recommended video:
Data Interpretation
Data interpretation involves analyzing and making sense of data presented in various formats, such as stemplots. It requires understanding how to extract meaningful information from the visual representation. In this case, interpreting the stemplot allows us to identify the specific values that fall within the range indicated by the stem, which is crucial for further statistical analysis.
Recommended video:
Visualizing Qualitative vs. Quantitative Data
Quantitative Data
Quantitative data refers to numerical information that can be measured and expressed mathematically. It is often used in statistics to perform calculations, create visualizations, and derive insights. The values represented in the stemplot are quantitative, as they reflect measurable quantities (e.g., counts, measurements) that can be analyzed to understand trends or patterns in the data.
Recommended video:
Visualizing Qualitative vs. Quantitative Data