Testing Effects of Alcohol Researchers conducted an experiment to test the effects of alcohol. Errors were recorded in a test of visual and motor skills for a treatment group of 22 people who drank ethanol and another group of 22 people given a placebo. The errors for the treatment group have a standard deviation of 2.20, and the errors for the placebo group have a standard deviation of 0.72 (based on data from “Effects of Alcohol Intoxication on Risk Taking, Strategy, and Error Rate in Visuomotor Performance,” by Streufert et al., Journal of Applied Psychology, Vol. 77, No. 4). Use a 0.05 significance level to test the claim that both groups have the same amount of variation among the errors.
Table of contents
- 1. Intro to Stats and Collecting Data1h 14m
- 2. Describing Data with Tables and Graphs1h 56m
- 3. Describing Data Numerically2h 5m
- 4. Probability2h 16m
- 5. Binomial Distribution & Discrete Random Variables3h 6m
- 6. Normal Distribution and Continuous Random Variables2h 11m
- 7. Sampling Distributions & Confidence Intervals: Mean3h 23m
- Sampling Distribution of the Sample Mean and Central Limit Theorem19m
- Distribution of Sample Mean - Excel23m
- Introduction to Confidence Intervals15m
- Confidence Intervals for Population Mean1h 18m
- Determining the Minimum Sample Size Required12m
- Finding Probabilities and T Critical Values - Excel28m
- Confidence Intervals for Population Means - Excel25m
- 8. Sampling Distributions & Confidence Intervals: Proportion2h 10m
- 9. Hypothesis Testing for One Sample5h 8m
- Steps in Hypothesis Testing1h 6m
- Performing Hypothesis Tests: Means1h 4m
- Hypothesis Testing: Means - Excel42m
- Performing Hypothesis Tests: Proportions37m
- Hypothesis Testing: Proportions - Excel27m
- Performing Hypothesis Tests: Variance12m
- Critical Values and Rejection Regions28m
- Link Between Confidence Intervals and Hypothesis Testing12m
- Type I & Type II Errors16m
- 10. Hypothesis Testing for Two Samples5h 37m
- Two Proportions1h 13m
- Two Proportions Hypothesis Test - Excel28m
- Two Means - Unknown, Unequal Variance1h 3m
- Two Means - Unknown Variances Hypothesis Test - Excel12m
- Two Means - Unknown, Equal Variance15m
- Two Means - Unknown, Equal Variances Hypothesis Test - Excel9m
- Two Means - Known Variance12m
- Two Means - Sigma Known Hypothesis Test - Excel21m
- Two Means - Matched Pairs (Dependent Samples)42m
- Matched Pairs Hypothesis Test - Excel12m
- Two Variances and F Distribution29m
- Two Variances - Graphing Calculator16m
- 11. Correlation1h 24m
- 12. Regression3h 33m
- Linear Regression & Least Squares Method26m
- Residuals12m
- Coefficient of Determination12m
- Regression Line Equation and Coefficient of Determination - Excel8m
- Finding Residuals and Creating Residual Plots - Excel11m
- Inferences for Slope31m
- Enabling Data Analysis Toolpak1m
- Regression Readout of the Data Analysis Toolpak - Excel21m
- Prediction Intervals13m
- Prediction Intervals - Excel19m
- Multiple Regression - Excel29m
- Quadratic Regression15m
- Quadratic Regression - Excel10m
- 13. Chi-Square Tests & Goodness of Fit2h 21m
- 14. ANOVA2h 28m
10. Hypothesis Testing for Two Samples
Two Proportions
Problem 12a
Textbook Question
Clinical Trials of OxyContin OxyContin (oxycodone) is a drug used to treat pain, but it is well known for its addictiveness and danger. In a clinical trial, among subjects treated with OxyContin, 52 developed nausea and 175 did not develop nausea. Among other subjects given placebos, 5 developed nausea and 40 did not develop nausea (based on data from Purdue Pharma L.P.). Use a 0.05 significance level to test for a difference between the rates of nausea for those treated with OxyContin and those given a placebo.
a. Use a hypothesis test.
 Verified step by step guidance
1
Step 1: Define the null and alternative hypotheses. The null hypothesis (H₀) states that there is no difference in the rates of nausea between the OxyContin group and the placebo group. Mathematically, H₀: p₁ = p₂, where p₁ is the proportion of nausea in the OxyContin group and p₂ is the proportion of nausea in the placebo group. The alternative hypothesis (Hₐ) states that there is a difference in the rates of nausea, i.e., Hₐ: p₁ ≠ p₂.
Step 2: Calculate the sample proportions for each group. For the OxyContin group, the proportion is p̂₁ = x₁ / n₁, where x₁ = 52 (number of subjects with nausea) and n₁ = 52 + 175 (total subjects in the OxyContin group). For the placebo group, the proportion is p̂₂ = x₂ / n₂, where x₂ = 5 and n₂ = 5 + 40.
Step 3: Compute the pooled proportion (p̂) under the null hypothesis. The pooled proportion is calculated as p̂ = (x₁ + x₂) / (n₁ + n₂), where x₁ and x₂ are the number of subjects with nausea in each group, and n₁ and n₂ are the total number of subjects in each group.
Step 4: Calculate the test statistic using the formula for the z-test for two proportions: z = (p̂₁ - p̂₂) / √[p̂(1 - p̂)(1/n₁ + 1/n₂)]. Substitute the values of p̂₁, p̂₂, p̂, n₁, and n₂ into the formula to compute the z-value.
Step 5: Compare the calculated z-value to the critical z-value for a two-tailed test at the 0.05 significance level (±1.96). If the calculated z-value falls outside the range of -1.96 to 1.96, reject the null hypothesis. Otherwise, fail to reject the null hypothesis. Additionally, you can calculate the p-value and compare it to 0.05 to make the decision.
 Verified video answer for a similar problem:
This video solution was recommended by our tutors as helpful for the problem above
Video duration:
7mPlay a video:
0 Comments
Key Concepts
Here are the essential concepts you must grasp in order to answer the question correctly.
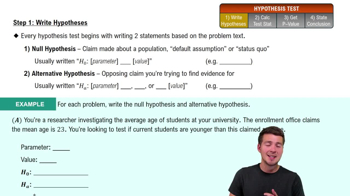
Hypothesis Testing
Hypothesis testing is a statistical method used to make inferences about population parameters based on sample data. It involves formulating a null hypothesis (H0) that represents no effect or difference, and an alternative hypothesis (H1) that indicates the presence of an effect or difference. The goal is to determine whether there is enough evidence to reject the null hypothesis at a specified significance level, often denoted as alpha (α).
Recommended video:
Guided course

Step 1: Write Hypotheses
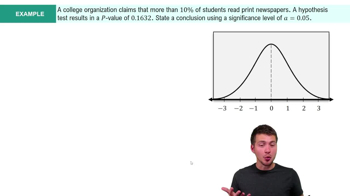
Significance Level
The significance level, commonly set at 0.05, is the threshold for determining whether the results of a hypothesis test are statistically significant. It represents the probability of rejecting the null hypothesis when it is actually true (Type I error). A significance level of 0.05 indicates that there is a 5% risk of concluding that a difference exists when there is none, guiding researchers in making decisions based on their data.
Recommended video:
Guided course

Step 4: State Conclusion Example 4
Contingency Table
A contingency table is a matrix used to display the frequency distribution of variables, particularly in categorical data analysis. In this context, it helps compare the occurrence of nausea between two groups: those treated with OxyContin and those given a placebo. By organizing the data into a contingency table, researchers can easily calculate proportions and perform statistical tests, such as the chi-square test, to assess the relationship between the treatment and the outcome.
Recommended video:
Guided course

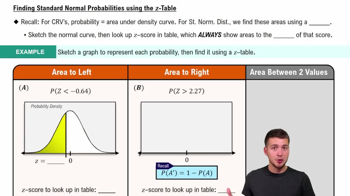
Finding Standard Normal Probabilities using z-Table

 9:27m
9:27mWatch next
Master Difference in Proportions: Hypothesis Tests with a bite sized video explanation from Patrick
Start learningRelated Videos
Related Practice
Textbook Question
